Résumé
This report assesses who has benefitted from the post-pandemic oil price boom, with a particular focus on Alberta’s big four oil and gas companies – Canadian Natural Resources, Cenovus Energy, Imperial Oil, and Suncor Energy.
In recent years, the net value added of the oil and gas industry has increasingly been distributed to owners instead of workers. From 2021-2023, the oil and gas industry made $135.2B in operating profits while paying workers only $43B. That’s $3.14 in profits for every dollar paid to workers, up from $0.92 in the previous oil price boom, 2011-2014. In the rest of the non-financial sector, there were $0.36 of profits for every dollar paid to workers over the same period.
These record profits have not led to increased investment. The big four’s investment fell from $27.9B per year from 2011-2014 to just $15.9B per year across 2021-2024. Instead, these companies increased payouts to shareholders. During the post-pandemic boom the big four paid out $8.4B per year in dividends and $11.5B per year in stock buybacks, up from $3.9B and $1.7B, respectively, from 2011-2014.
This is particularly notable, because although most Canadian corporations are majority-owned by Canadians, the big four are 60% American-owned, and only 27% Canadian-owned. As a result, we estimate that the big four paid out over $58 billion of profits to foreign owners through dividends and stock buybacks from 2021-2024. These profits not only failed to benefit workers, they left the country altogether.
These massive profits were possible in large part because the industry has increased production without increasing employment or wages. In 2024, Canada’s oil and gas production hit a record 8.4 million barrels of oil equivalent per day, up from under 6 million in the early 2010s. Despite the increased production, average labour expenses per worker are lower and the industry employs 30,000 fewer workers than it did in 2014.
From 2021-2023, the oil and gas industry paid only 14.3% of its profits in taxes, much lower than other sectors of the Canadian economy at 19.1%. Notably, all of the big four companies paid a lower effective tax rate from 2021-2024 than they did during 2011-2014. Government royalty revenues on the other hand, have increased during the oil price boom.
The oil and gas industry – and in particular the big four – has served its largely American owners far better than its workers, or Albertans, in recent years. Government support must be directed toward industries that will create jobs, rather than towards an industry that increasingly extracts profits for its foreign owners using our natural resources.
This report is a collaboration between the Alberta Federation of Labour and Canadians for Tax Fairness.
Rapport
Introduction
The surge in inflation that created a cost of living crisis in Canada was primarily caused by the post-pandemic spike in oil prices. In this report, we examine who has benefitted from this oil price boom and from the expansion of the oil and gas industry over the past fifteen years. We find that the benefits of recent expansion and the recent oil price boom were overwhelmingly captured by oil and gas companies’ owners, many of whom are foreign. Based on this evidence, we recommend that Alberta adopt a focused industrial policy that places workers at the center.
Using financial data from Statistics Canada and corporate financial reports, this report examines how the value added to the economy by the oil and gas industry is distributed between workers and corporate owners, and how that distribution has shifted over time. We examine Canada’s oil and gas industry as a whole and focus on the four major corporations that dominate production in the Alberta oil sands: Canadian Natural Resources, Cenovus Energy, Imperial Oil, and Suncor Energy. These four companies had a record 2.8 million barrels per day of oil sands production in 2024, over 80% of total oil sands production.
We find that, during the post-pandemic oil price boom, an increasing portion of the value added of the industry has gone to owners, who are disproportionately foreign. 60% of the shares of the big four companies are owned by Americans specifically. Since 2021, profits surged in the oil and gas industry but neither investment nor worker compensation followed suit. While royalties did significantly contribute to public revenues over this period, the effective tax rates of the industry were much lower than during the previous oil price boom (2011-2014) thanks to increased tax credits and exemptions.
More broadly, according to the Canadian Climate Institute, without further legislative action to reduce emissions, Canada will miss its 2030 emissions target by 109 megatonnes, or 25%. Even if all announced commitments end up being legislated, Canada is 42 megatonnes short of the 2030 target. Failing to meet this target, and working with allies to help them meet theirs, will result in accelerated climate change-induced destruction through wildfires, droughts, and heat waves that we are already witnessing today. And, yet, there is a renewed interest in building pipelines and drives to abandon the proposed cap-and-trade system for oil and gas emissions.
Rather than directing more public funds into private foreign-owned companies, we must develop an industrial policy that reduces emissions and advances workers’ standard of living. Alberta’s industrial policy could include using hydrocarbons to produce materials, developing a clean fuels industry, electrifying transportation, and retrofitting buildings. The public sector must take a leading role to achieve these goals. Through its leadership, it can ensure well-paying jobs are created, community needs are met through community benefit agreements, and profits stay within Canada by taking a public ownership stake. The recent shift towards profits at the expense of workers in the oil and gas sector shows what can happen when the public sector does not take a leading role.
How the value created by oil and gas is distributed
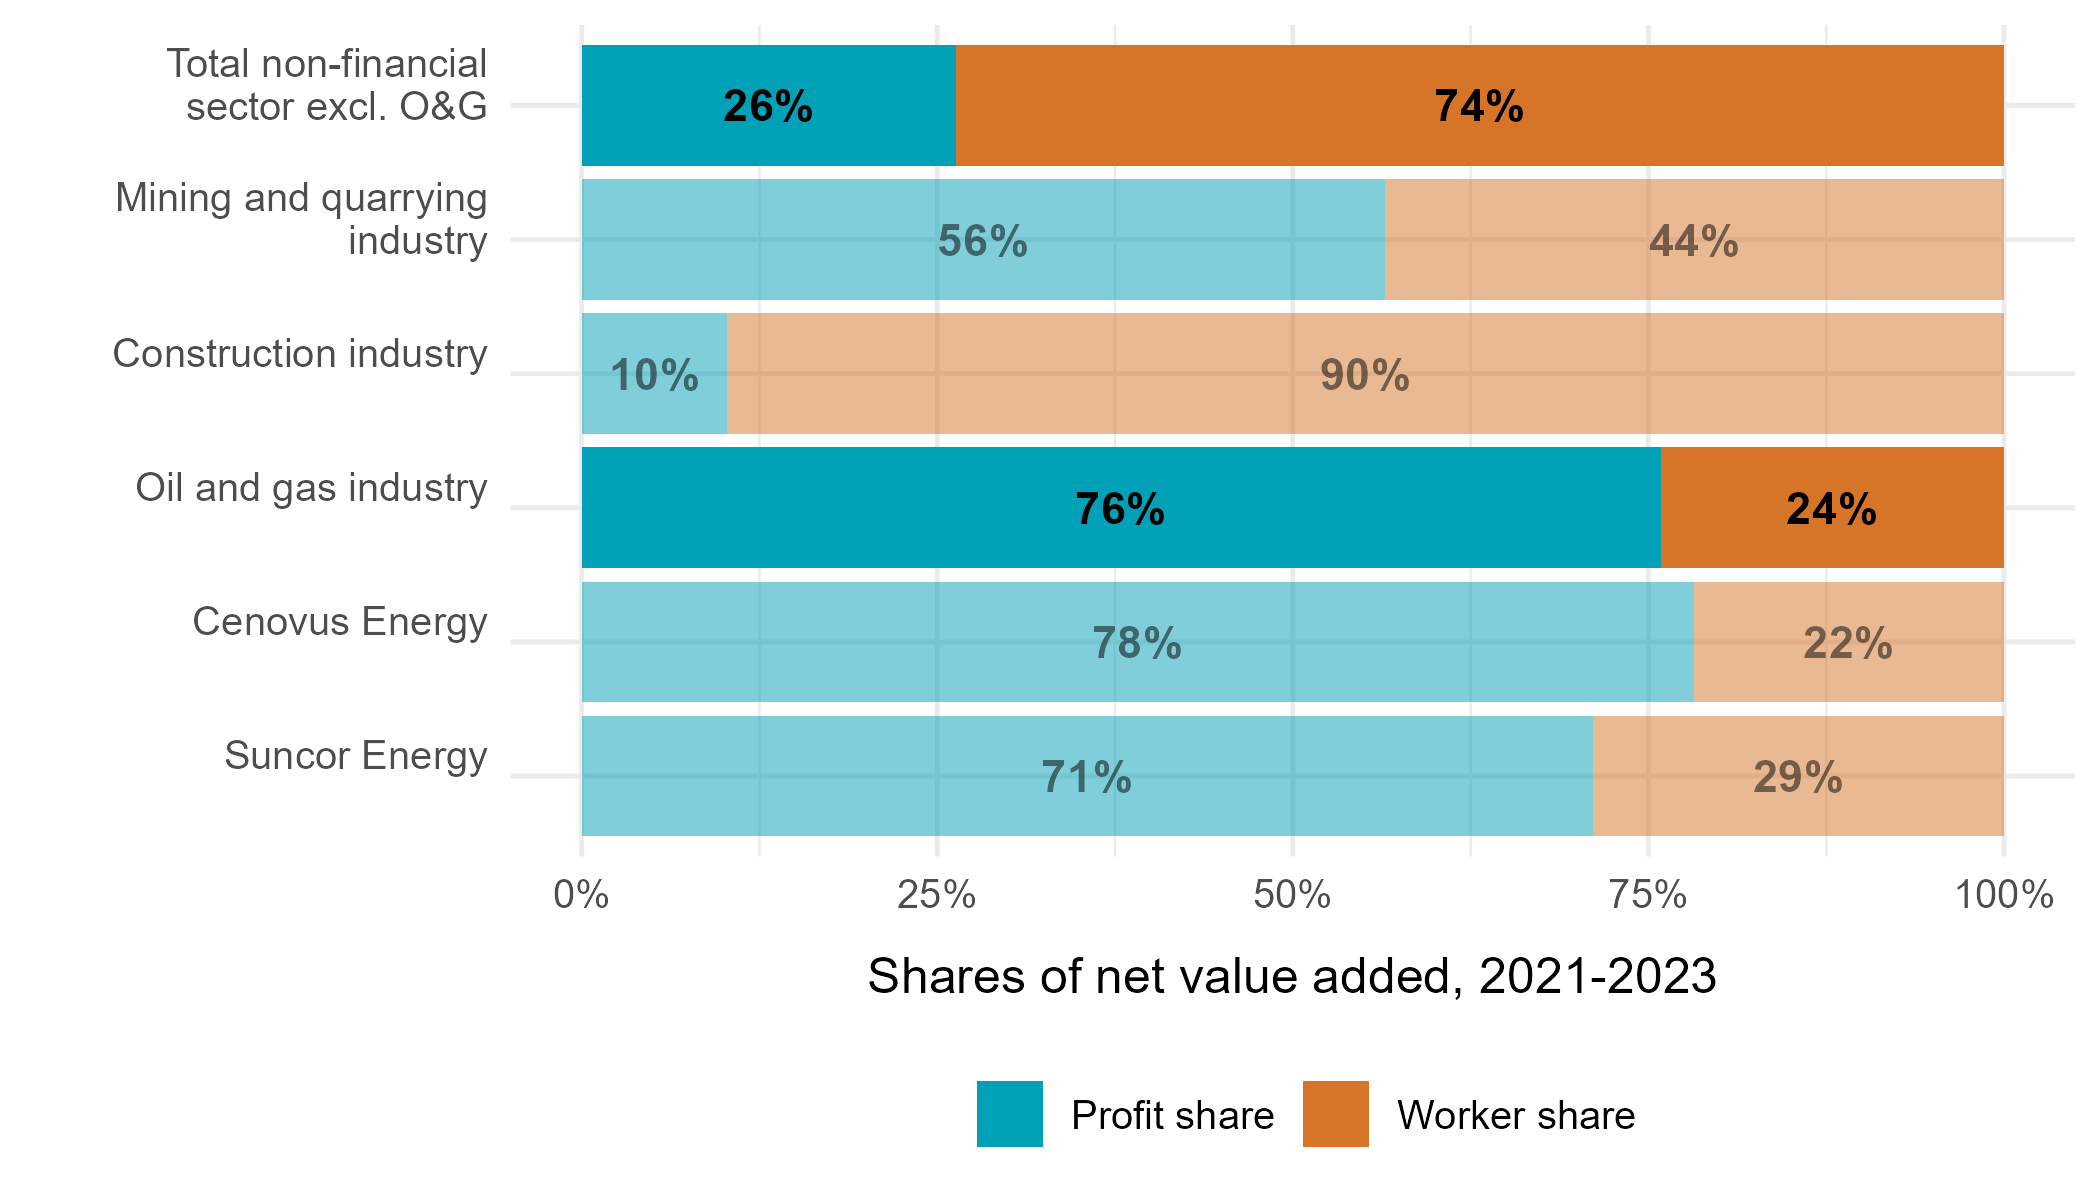
Compared to other Canadian industries, a far greater share of the value generated by the oil and gas industry goes to profits and far less goes to workers. Across 2021-2023, 76% of the net value added of the oil and gas industry went to owners as profits and only 24% went to workers in the form of salaries and other benefits. In the rest of the non-financial sector, only 26% of net value added went to profits and 74% went to workers.
This is not merely due to the distinction between goods-producing industries and the service sector. The worker share of net value added in construction, another goods-producing industry, was 90%. Part of the gap can be explained by the capital-intensive nature of resource extractive industries. Mining and quarrying, another capital-intensive extractive industry, had a worker share of 44%, smaller than other non-financial industries, but still far larger than that of oil and gas. The oil and gas industry has a structure that is uniquely profitable for owners while providing little for workers.
Among the big four oil and gas companies studied in this report, only Cenovus and Suncor publish enough data for us to estimate net value added at the firm level. Similar to the industry as a whole, we estimate that 78% of Cenovus’ value added went to profits and 71% of Suncor’s value added went to profits across 2021-2023. Both firms were roughly in line with trends for the industry as a whole, with higher profit shares and lower worker shares than other sectors.
Profit and worker shares of net value added in the oil and gas industry, comparison industries, and two large oil and gas companies, 2021-2023.
Figure 1. Profit and worker shares of net value added in the oil and gas industry, comparison industries, and two large oil and gas companies.
Notes. Authors’ calculations based on Statistics Canada Table 33-10-0500-01 and firm financial reports. See Methods section for more details. Oil and gas industry includes oil and gas extraction (including oil sands extraction) and support activities for oil and gas extraction. Mining and quarrying industry includes mining and quarrying and support activities for mining and quarrying.
The oil and gas industry has not always been structured this way. We compared the post-pandemic oil price boom to the previous boom in 2011-2014. During the 2011-2014 oil price boom, the profit share of net value added in the oil and gas sector was only 48.0%, compared to 75.9% during the recent boom. The worker share was 52.0% across 2011-2014, over double its level from 2021-2023, 24.1%.
On the other hand, the distribution of net value added in the rest of the non-financial sector was relatively similar during both oil price booms, with a small shift away from workers and towards profits over time.
Table 1. Profit and worker shares of net value added during two oil price booms.
|
|
Billions $ |
Shares |
|||
|
Industry |
Period |
Profits |
Workers |
Profits |
Workers |
|
Oil and gas |
2011-2014 |
64.2 |
69.6 |
48.0% |
52.0% |
|
2021-2023 |
135.2 |
43.0 |
75.9% |
24.1% |
|
|
Non-financial sector excl. O&G |
2011-2014 |
623.3 |
1,972.3 |
24.0% |
76.0% |
|
2021-2023 |
957.9 |
2,678.6 |
26.3% |
73.7% |
Notes. Author’s calculations based on Statistics Canada Table 33-10-0500-01. See Methods section for details.
In the next sections, we explain how the oil and gas industry became so tilted towards profits and who has benefitted from the transformations in the industry.
Profits in the oil and gas industry
The oil and gas industry achieved record levels of profits in the post-pandemic period. However, while the industry’s profits set records, the high oil prices had been experienced before, during the 2011-2014 oil price boom. Across 2011-2014, the industry collected $64.2 billion in operating profits, about $16 billion per year. From 2021-2023, the industry collected $135.2 billion in operating profits, over $45 billion per year.
This huge discrepancy in profits for two periods with similar oil prices can be explained by a few factors. First, oil and gas production had increased significantly by the latter period. Second, despite the increased production, worker compensation declined from $17.4 billion per year from 2011-2014 to $14.3 billion per year from 2021-2023. Workers were paid less to produce more. So who benefitted from the spike in oil and gas profits and what were these record profits used for?
Foreign ownership of Canada’s oil and gas industry
Critical to evaluating who benefits from oil and gas profits is clarifying who owns the industry. Owners receive value from profits through dividends, share repurchases, and increases in share prices. They also determine who exercises control over the corporations’ actions. Owners select the boards of directors that make and approve most big decisions corporations make. Through these selections owners can influence which projects companies undertake, whether they expand employment or lay off workers, and how much is paid out to themselves.
On average, according to Statistics Canada, 14.7% of Canadian corporate assets are owned by foreigners, including 7.7% of assets which are owned by Americans. For the oil and gas industry, the rate of foreign ownership is more than double the average of the rest of the Canadian economy. A full 36.5% of oil and gas assets are foreign-owned, including 15.6% owned by Americans.
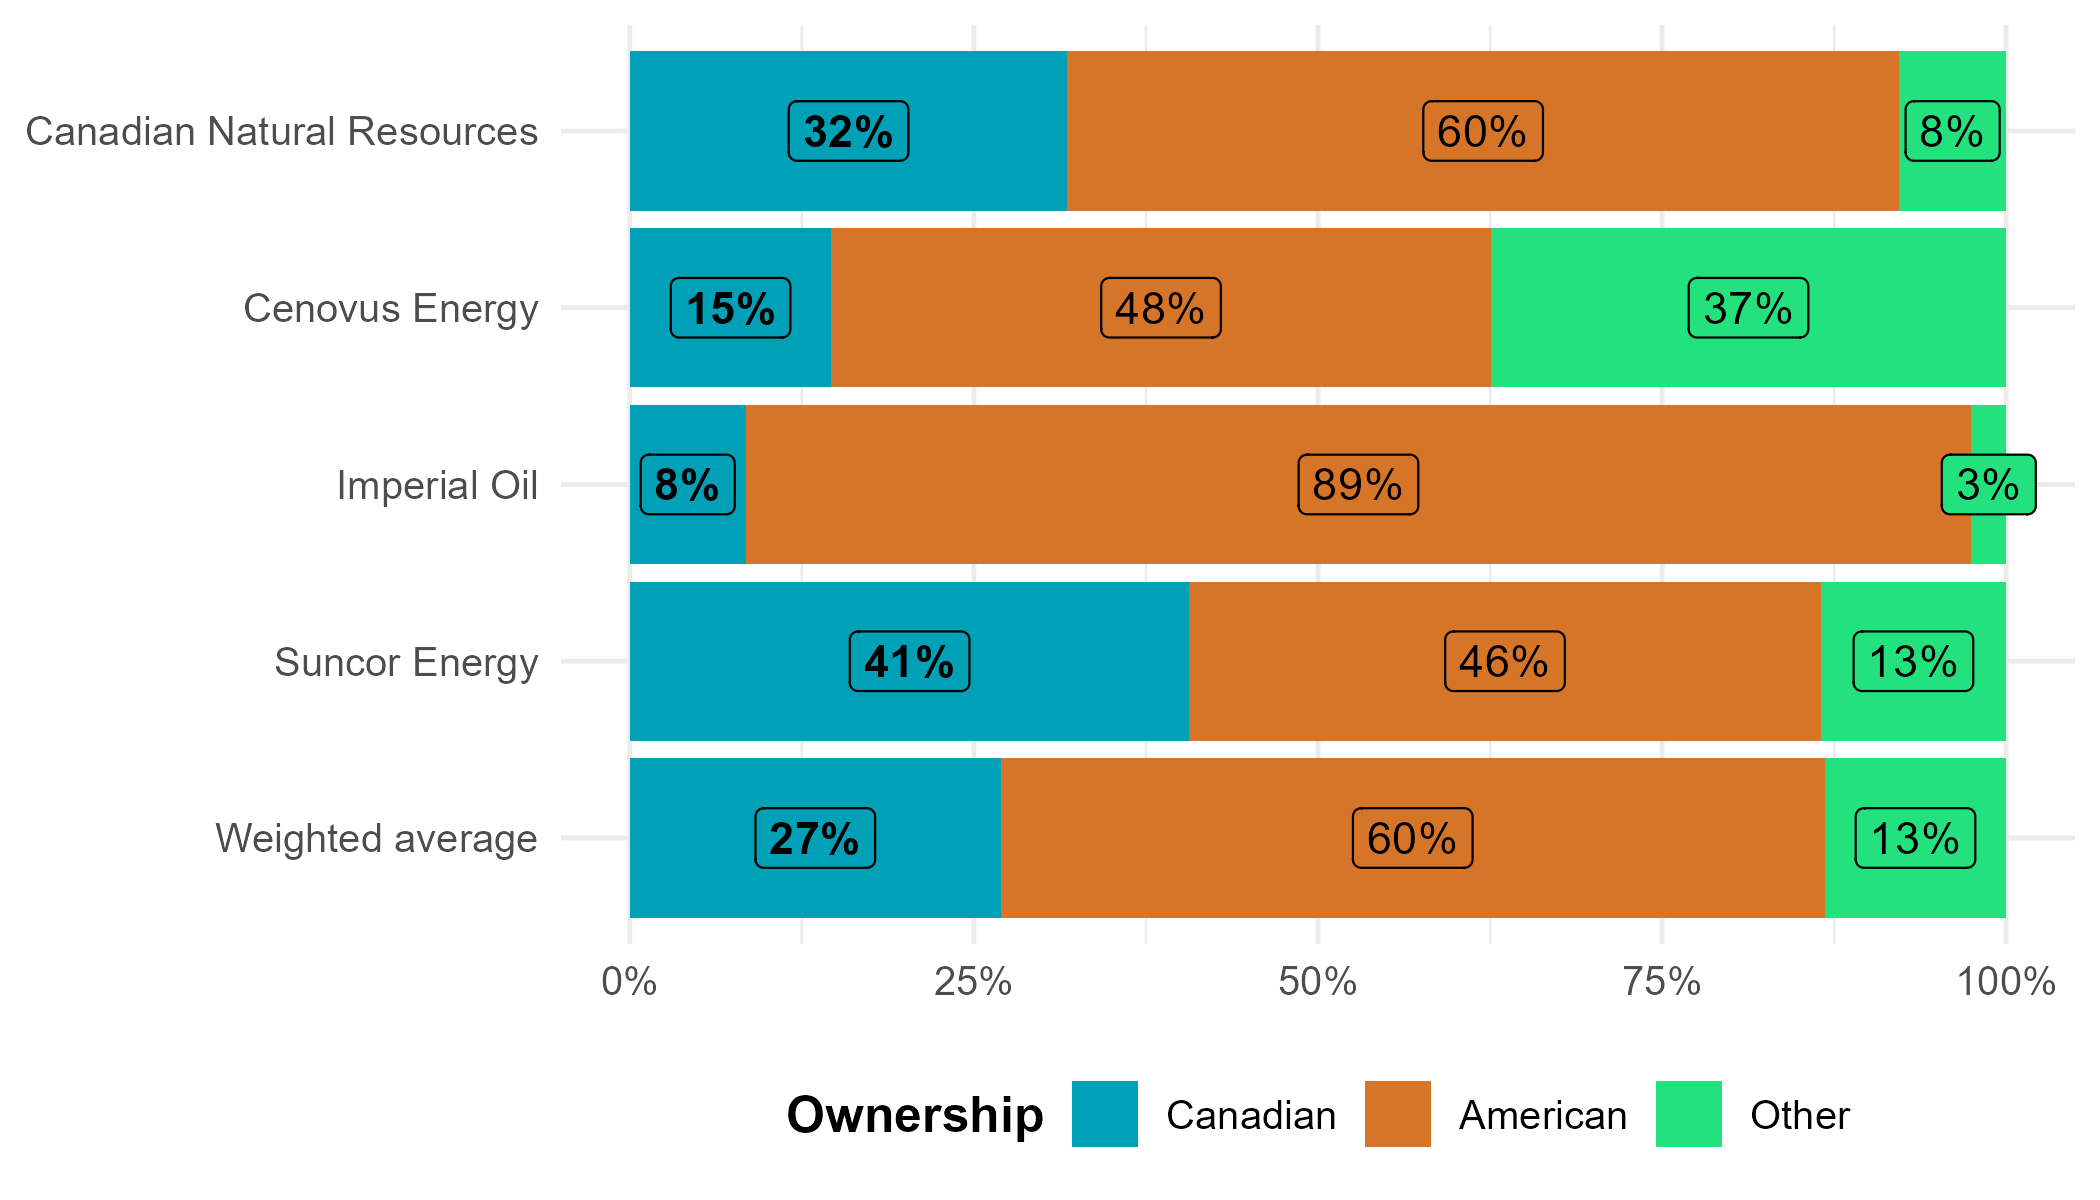
When we examine the big four oil and gas companies, the picture is even more stark. Although there is some uncertainty, we estimate, in line with previous research, that these four companies are on average 73% foreign-owned, including 60% American-owned (see Methods section for a more detailed explanation of our estimation strategy). None of the big four are majority-owned by Canadians, ranging from roughly 8% Canadian ownership for Imperial Oil to 41% Canadian ownership for Suncor Energy. This raises questions about whether the major corporations making decisions about production and employment in Canada’s oil sands are acting in the best interests of Canadians.
Big four oil and gas companies are estimated to be 73% foreign owned
Figure 2. Big four oil and gas companies are estimated to be 73% foreign-owned.
Notes. Authors’ estimations based on data from Nasdaq, MarketScreener, and SEC 13-F filings. See Methods section for estimation details.
Four of the five largest owners of Canadian Natural Resources are American investment managers. Cenovus Energy’s largest shareholders are an investment company and a family trust, both of which are controlled by Li Ka-Shing, a Hong Kong-based billionaire, and his family. This is the result of the 2020 merger between Cenovus Energy and Husky Energy, which was majority-owned by the Li Ka-Shing family. The rest of Cenovus Energy’s five largest shareholders are all American investment managers.
Imperial Oil is a subsidiary of American oil giant ExxonMobil, one of the largest companies in the world, which controls roughly 70% of Imperial. Imperial’s top five shareholders also include three American investment managers. Suncor’s largest shareholders include four American investment managers.
Table 2. Top five owners of the big four oil and gas companies.
|
Rank |
Canadian Natural Resources |
Cenovus Energy |
Imperial Oil |
Suncor Energy |
|
1 |
Capital World Investors (US, 12.5%) |
CK Hutchison Holdings (HK, 17.4%) |
ExxonMobil (US, 69.6%) |
Royal Bank of Canada (CA, 5.3%) |
|
2 |
Royal Bank of Canada (CA, 5.0%) |
Li Family (HK, 12.7%) |
FMR LLC (US, 8.5%) |
Vanguard Group (US, 4.2%) |
|
3 |
Capital Research Global Investors (US, 4.6%) |
Capital World Investors (US, 10.5%) |
First Eagle Investment Management (US, 4.2%) |
Elliott Investment Management (US, 4.2%) |
|
4 |
FMR LLC (US, 4.4%) |
Capital International Investors (US, 2.9%) |
Royal Bank of Canada (CA, 1.5%) |
T. Rowe Price International (US, 2.3%) |
|
5 |
Vanguard Group (US, 4.2%) |
Vanguard Group (US, 2.7%) |
Vanguard Group (US, 1.3%) |
Dodge & Cox (US, 2.3%) |
Notes. Data obtained from Marketscreener and Nasdaq, current as of December 31, 2024. Country of incorporation and proportion of outstanding shares held displayed in parentheses.
Many of the largest shareholders of each of the big four oil and gas companies are the same institutions. RBC is one of the top five shareholders in three of them. In fact, 46 institutions are among the largest 100 institutional shareholders of all four companies. The largest owners include FMR LLC, Vanguard Group, Mackenzie Financial, and BMO, in addition to RBC. This phenomenon suggests that the four companies have little incentive to compete with another, as it is the same financialized institutions who benefit whether any of the four companies succeed. In this light, the recent evidence that two US oil executives allegedly engaged in oil price collusion is not surprising.
Where do oil and gas profits go?
Profits, after paying income taxes, can be invested in new projects, distributed to owners through dividends and stock buybacks, or retained within the company, increasing the value of the shares held by the owners. In recent years, oil and gas profits have been increasingly used to generate value for owners, rather than being reinvested. Because the big four oil and gas companies are mostly foreign-owned, their profits largely benefit foreign owners.
The post-pandemic years were very profitable for the big four oil and gas companies because of the boom in oil prices. From 2021 through 2024, the big four alone made $131.6B in operating profits, about $28.8B of which was owed in income taxes (because of tax deferrals, only $26.7B was actually paid).
Operating profits, investment, dividends, and share repurchases for the big four oil and gas companies, 2011-2024.
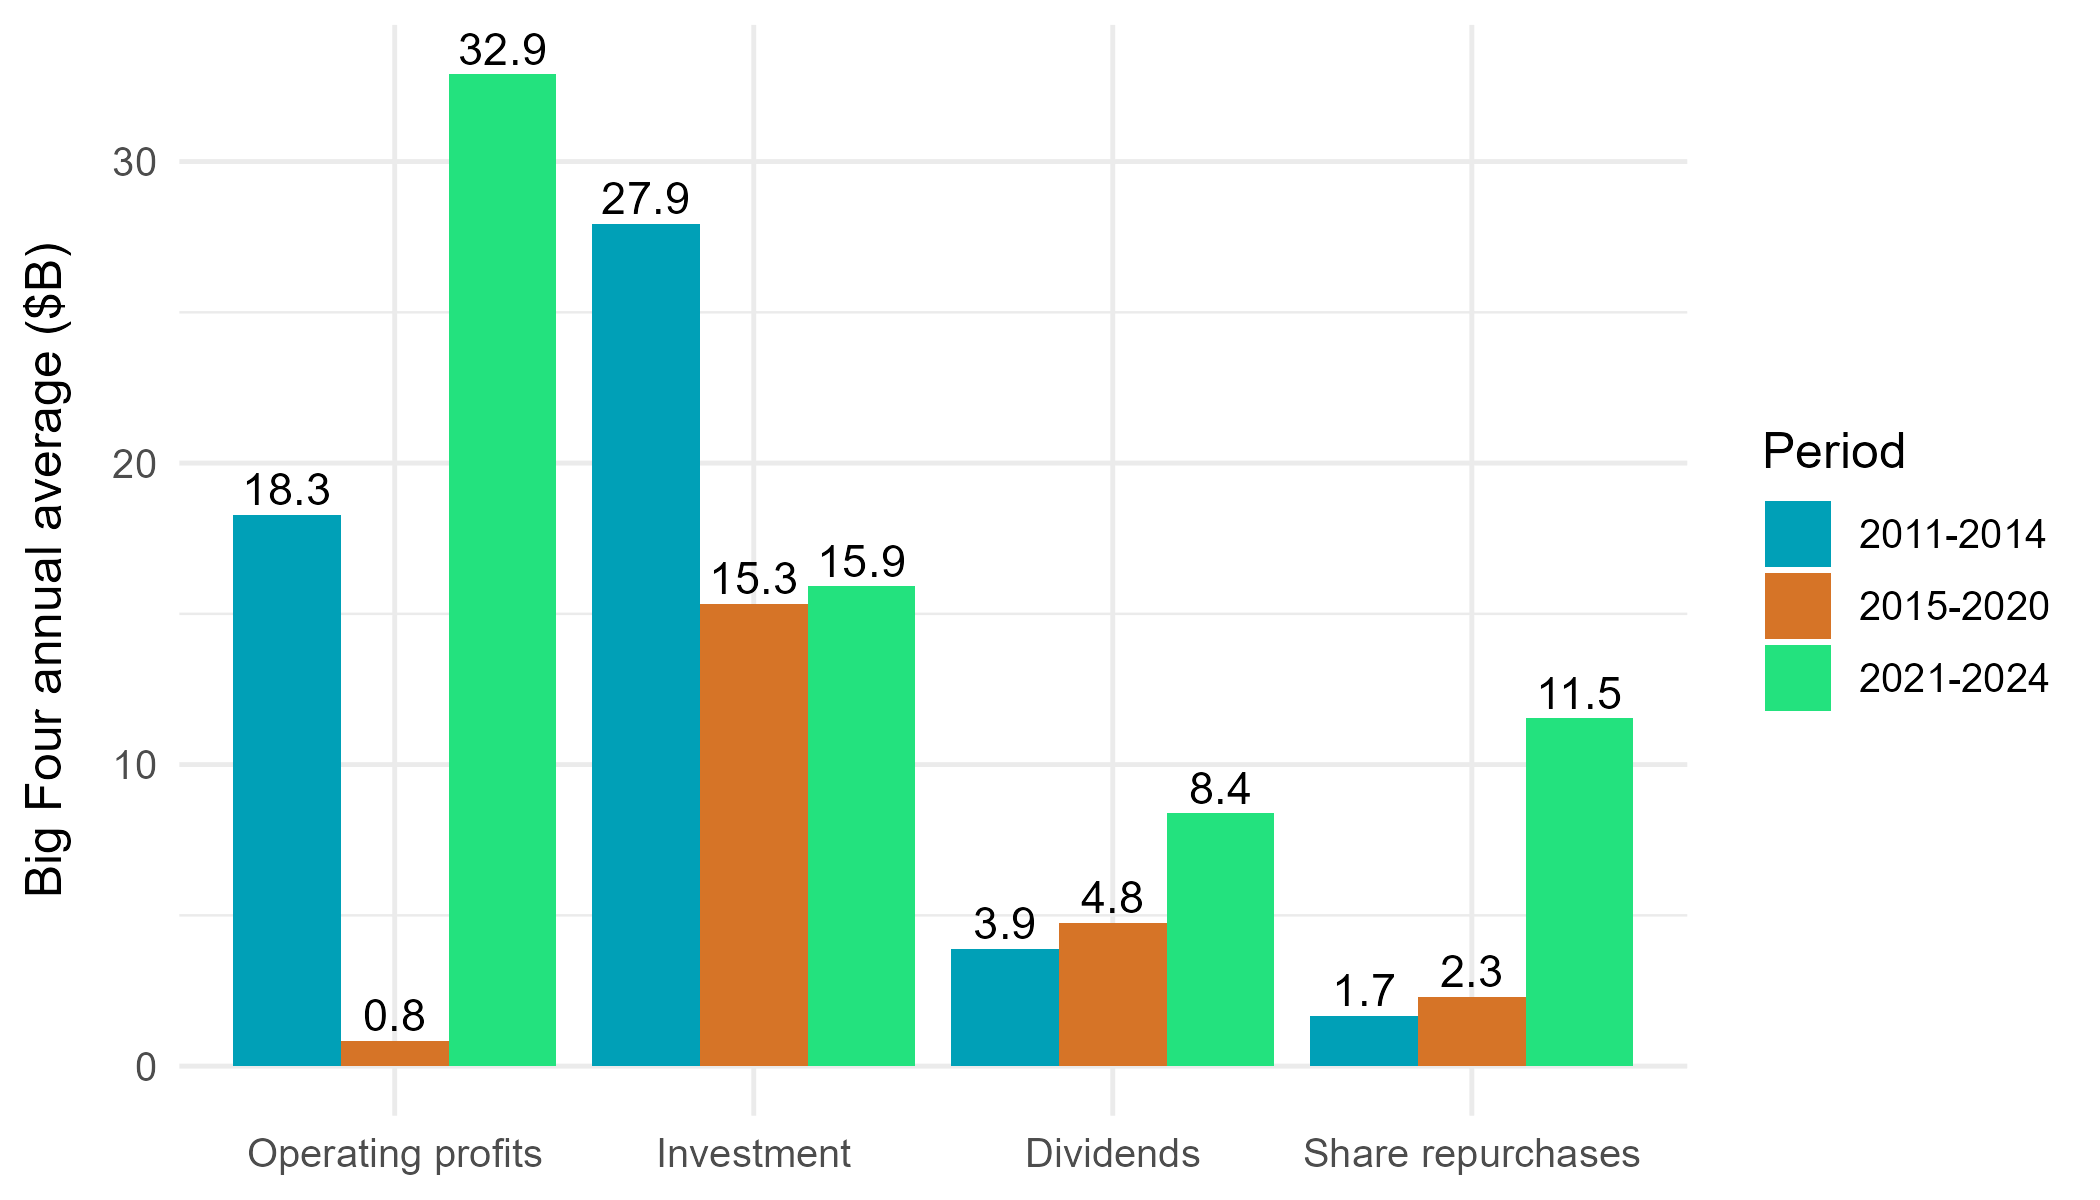
Figure 3. Operating profits, investment, dividends, and share repurchases for the big four oil and gas companies, 2011-2024.
Notes. Authors’ calculations based on data from Compustat North America. Values are the average across the years in the period of the total across all four companies.
It is commonly argued that companies need to be profitable in order to reinvest, therefore profits will lead to investment, jobs and productivity growth. However, much investment is not paid out of current profits. This is because of an element of the tax code called capital cost allowances. Capital cost allowances allow a significant portion of investment to be written off as an expense, reducing recorded profits and taxable income, as opposed to being paid out of profits. This means that investment often has little relation to current profits – it could be high in low-profit periods or low in high-profit periods. Companies largely make investment decisions based on expectations of future profitability, not current profits.
The financial statements of the big four oil and gas companies demonstrate this. When profits skyrocketed during the recent oil price boom, the big four did not substantially increase investment. In fact, across the four companies, investment was $12B per year lower than it was during the 2011-2014 oil price boom despite operating profits being $14.6B higher. Instead, it was dividends and share repurchases that increased. Dividends nearly doubled, reaching $8.4B per year, or $33.5B in total. Share repurchases (also known as stock buybacks) are another way companies can use their cash to return value to shareholders, and they increased from $2.3B per year in the 2015-2020 period to $11.5B per year across 2021-2024.
Oil and gas companies are not being prevented from investing by regulatory burdens. Instead, as explained by University of Alberta economist Andrew Leach, “It's not because of the federal government or lack of pipelines. The biggest challenge comes from eroding global oil demand.” Oil companies recognize that global action to prevent climate change and the declining cost of renewable energy have reduced projected demand for oil and thus the expected profitability of new projects. This is especially true for oil that is expensive to extract, like that of the oil sands. The International Energy Agency recently concluded that global oil demand growth is expected to slow “to just a trickle over the next several years, with a small decline expected in 2030”. In this context, it makes sense that companies are choosing to prioritize returns to shareholders over reinvesting. But that does not mean it is good for Albertans or Canadians.
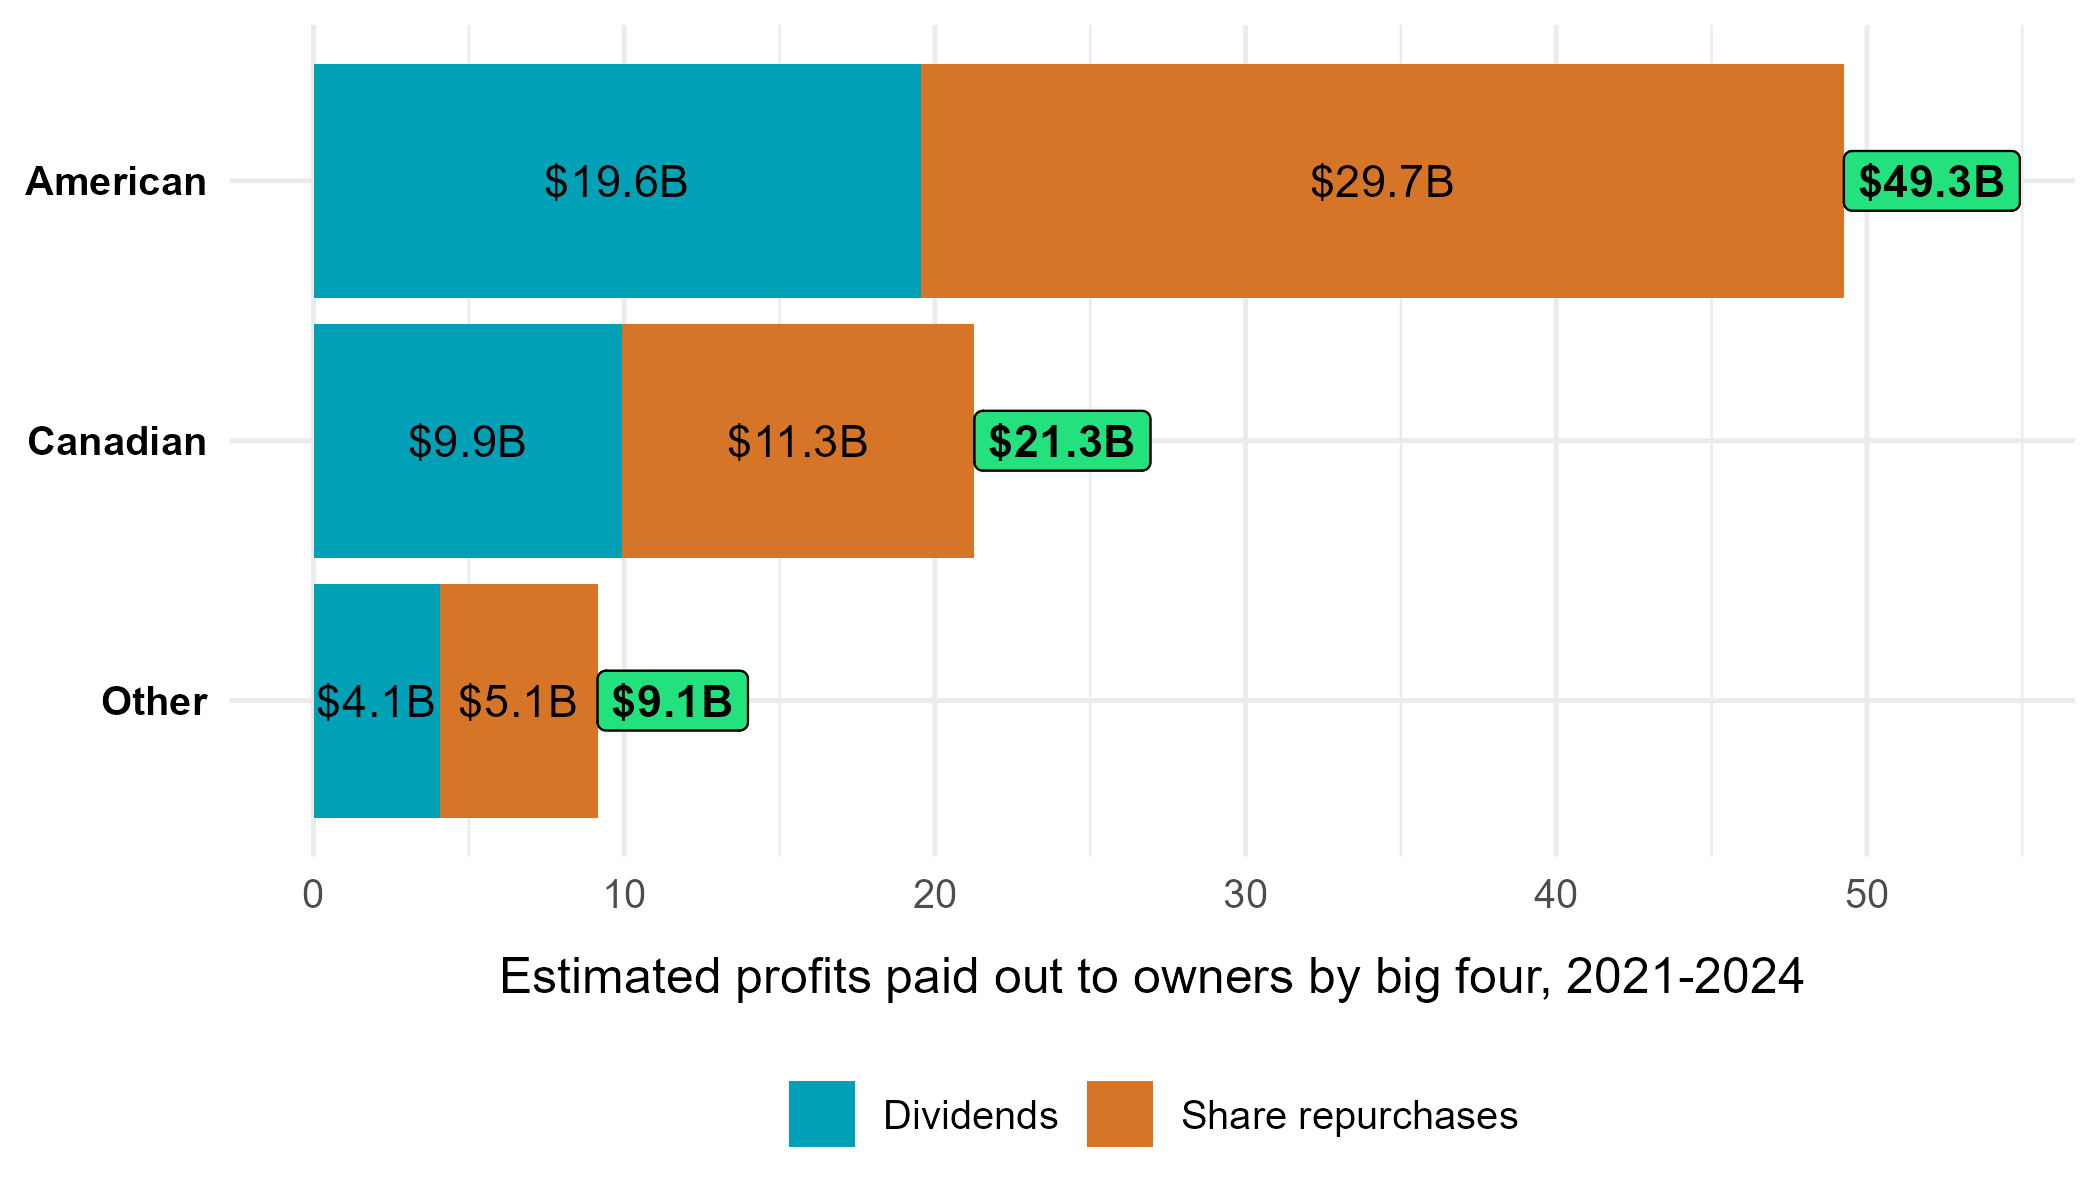
Because of the disproportionate foreign ownership of the big four oil and gas companies, a lot of their profits end up leaving the country. Assuming that dividends and share repurchases are distributed proportionally to owners in different jurisdictions, we estimate that the big four paid out $58.4B to foreign owners from 2021-2024, or $14.6B annually. This includes $49.3B paid to American owners. Only $21.3B, or $5.6B annually, was paid out to Canadian owners.
Estimated dividends and share repurchases paid by the big four to owners by country of ownership, 2021-2024.
Figure 4. Estimated dividends and share repurchases paid by the big four to owners by country of ownership, 2021-2024.
Notes. Authors’ calculations based on data from Compustat and estimated ownership by country.
When the big four’s profits are paid out in dividends or share repurchases to foreign owners, that money leaves the Canadian economy, meaning it is not reinvested in Canada nor used to purchase Canadian goods. This is money that was earned in Canada (mostly in Alberta) through production of Canadian natural resources by Canadian workers, yet goes to benefit foreign owners.
Workers and production in the oil and gas industry
Workers are central to the story of how the oil and gas industry benefits Alberta, and Canada as a whole. The conventional story argues that Albertans have grown rich off of oil. Recent technological advancements, however, mean that Albertan workers are less and less needed to produce Albertan oil and gas.
In 2011, there were over 162,000 workers employed in the oil and gas industry in Canada. Employment peaked during the boom of the early 2010s, topping 176,000 in 2013. By 2024, despite another oil price boom, there were only 144,550 workers employed in the industry. This drop in employment also occurred while the industry reached record levels of crude oil production in Canada in 2024. In fact, overall oil and gas production has increased from approximately 5.6 million barrels of oil equivalent per day (boe/d) in 2011 to 8.4 million boe/d in 2024. It is clear that the Canadian oil and gas sector has required less labour over time to produce more crude oil. In 2011, 34.6 boe/d were produced for every worker. By 2024, 58.1 boe/d were produced for every worker.
The same story applies to the big four. In 2011, the big four employed 32,900 workers and produced about 2 million boe/d of oil and gas. By the end of the oil price boom in 2014, the big four employed 38,600 workers and produced about 2.3 million boe/d. In 2024, they employed scarcely any more workers, 40,000, but they produced a whopping 3.4 million boe/d. Overall, employment increased by 22% from 2011-2024 while production increased by 72%.
Moreover, increasing productivity per employee has not translated into higher wages and benefits in the industry. Labour expenses per employee were only $106,300 in 2023, despite having reached $111,900 back in 2014. In real terms, this is a 24.5% cut in real average wages.
The combination of lower employment and lower wages explains how the oil and gas industry spent less on labour expenses in 2023, $15.1B, than it did at the beginning of the previous oil price boom in 2011. For comparison, labour expenses in the private non-financial sector as a whole more than doubled over the same period. Unfortunately, not all of the big four oil and gas companies report their payroll expenses. However, in 2022, Cenovus reported that it spent $2.5B on share repurchases while spending only $1.7B on salaries and benefits.
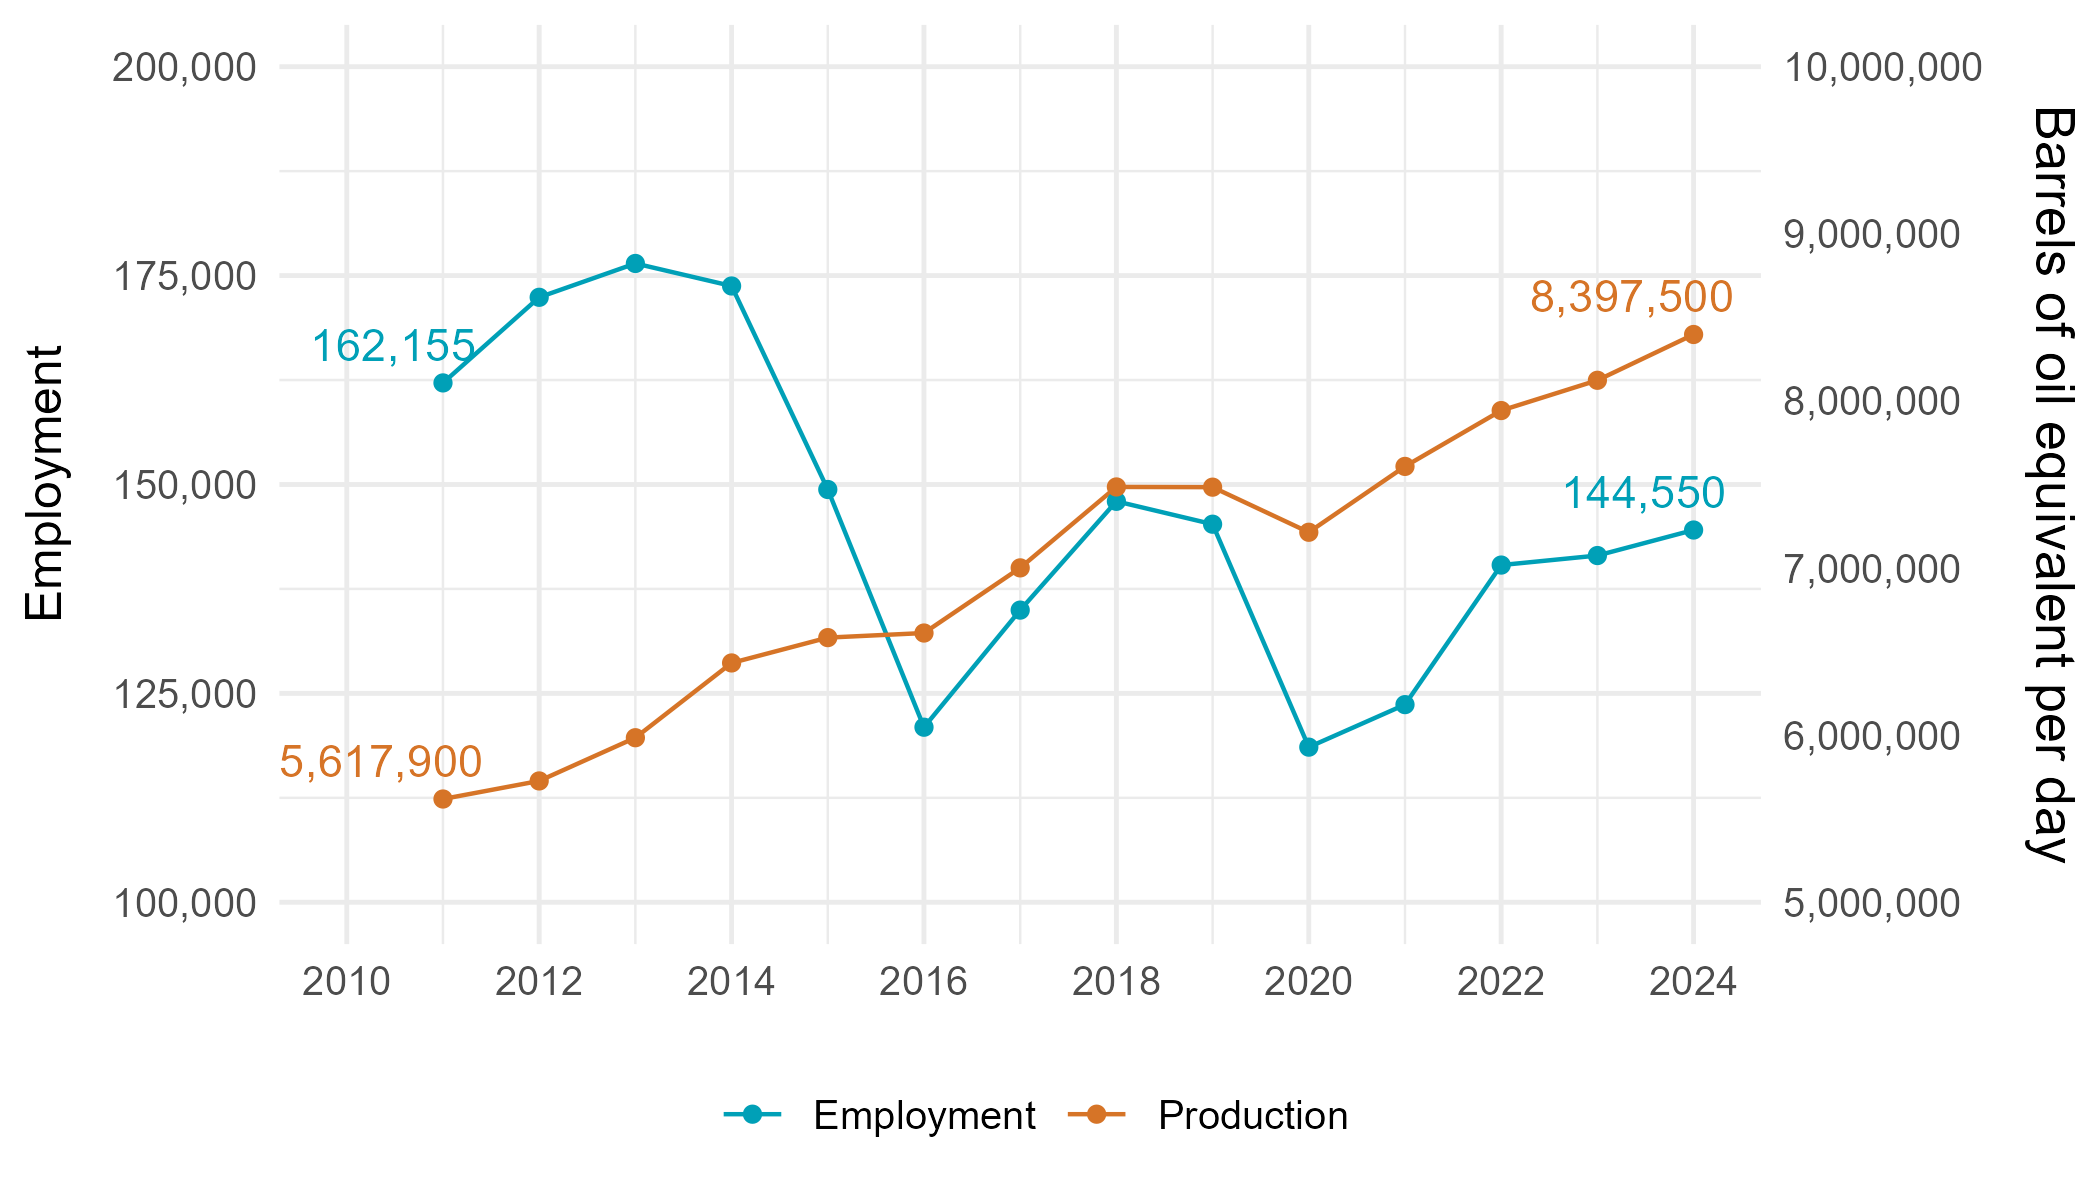
Oil and gas industry employment and production, 2011-2024.
Figure 5. Oil and gas industry employment and production, 2011-2024.
Notes. Data from Statistics Canada Table 36-10-0489-01 and Canada Energy Regulator.
Over the past decade, the oil and gas industry has shifted from a phase of development to a phase of profit extraction. Building oil and gas infrastructure does require significant labour. But once the necessary infrastructure is built, fewer workers are needed to extract huge amounts of oil. Today, the profitability of investing in new infrastructure is extremely uncertain. The International Energy Agency projects global oil demand to peak by 2029, as people around the world experience the harms of climate change firsthand, and efforts to reduce emissions increase. Oil and gas companies know this. This is why investment has remained low even after record profits. They were unwilling to complete the Trans Mountain expansion without federal funding and are now asking for more public funding for new pipelines and carbon capture and storage projects. Industry has proved unwilling to make risky job-creating investments without government guarantees.
Government revenues from the oil and gas industry
Aside from direct wages and benefits to workers, the oil and gas industry benefits Albertans and Canadians through government revenues. There are two main channels through which the industry generates public revenue – income taxes, and royalties.
Income taxes
Among the 28 Canadian industries with at least $10B in profits over 2021-2023, only real estate and agriculture had a lower effective tax rate (ETR) than the oil and gas industry. Over this period, the oil and gas industry had an effective tax rate of 14.3%, meaning the industry paid only 14.3% of its profits in taxes. As a whole, the non-financial sector had an effective tax rate of 19.1% over this period. The combined federal and provincial statutory corporate income tax rate in Canada ranges from 23% in Alberta to 30% in Prince Edward Island and Newfoundland and Labrador.
The significant difference between the statutory income tax rate and the effective tax rate paid by the oil and gas industry is a result of myriad loopholes, deductions and tax credits in the tax code. In 2023, the federal government pledged to eliminate all “inefficient” oil and gas subsidies, which would in theory help bring oil and gas’ ETR in line with other industries. However, in the 2024 fall economic statement, the government said it planned to extend a very generous tax deduction for oil and gas, accelerated capital cost allowances, directly contravening their earlier pledge. Subsidies like this help the oil and gas industry keep its effective tax rate so low. Accelerated capital cost allowances have allowed the industry to reduce their taxable income by over $61B since 2002, more than all other non-financial industries combined.
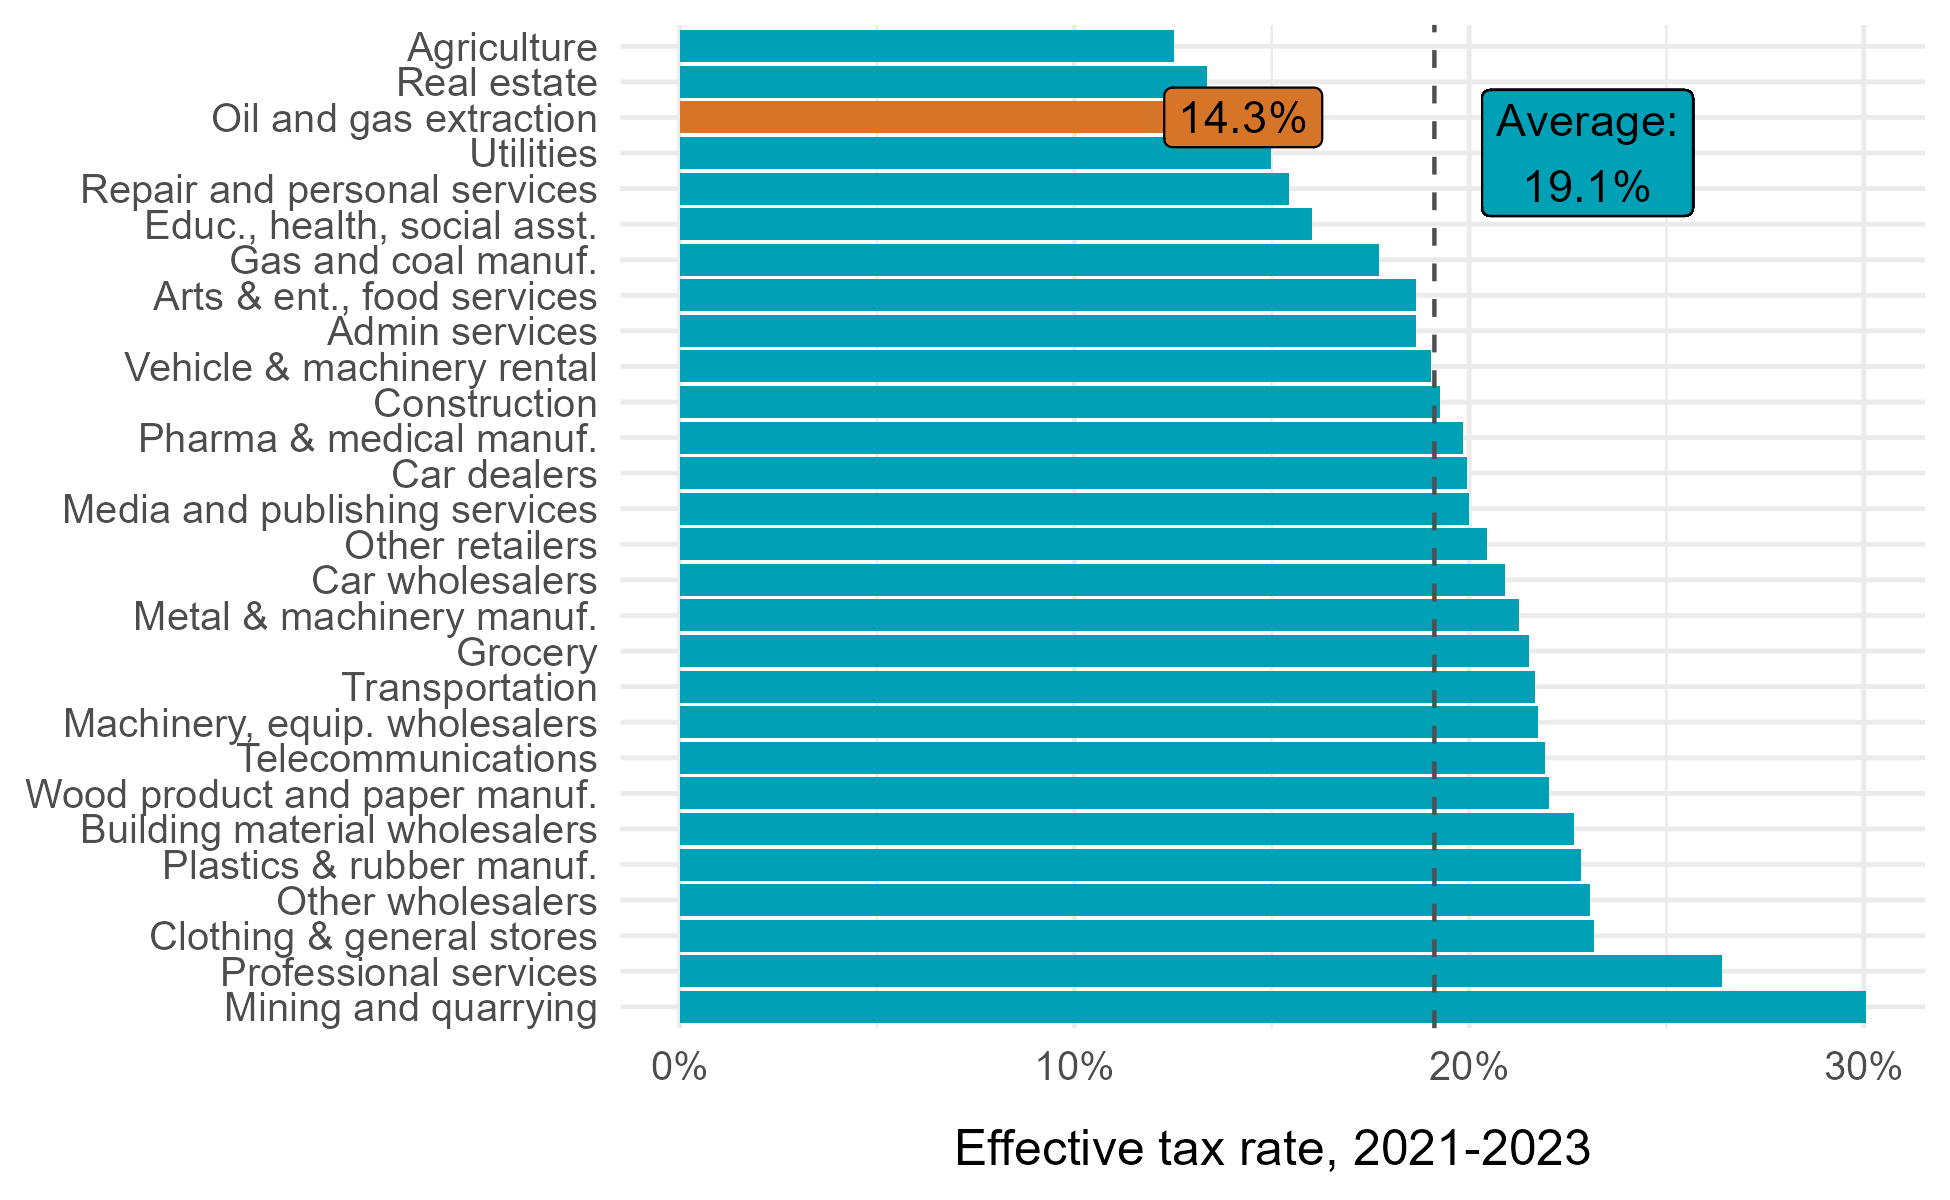
Effective tax rates in large non-financial industries, 2021-2023.
Figure 6. Effective tax rates in large non-financial industries.
Notes. Data from Statistics Canada Table 33-10-0500-01. Effective tax rate = (Current income tax expense + deferred income tax expense) / Income or loss before income taxes. Only non-financial industries with at least $10B in taxable income across 2021-2023 are included.
We can also calculate effective tax rates for the big four oil and gas companies. During the recent oil price boom of 2021-2024, their effective tax rates were roughly in line with statutory tax rates. However, their ETRs are far lower than they were during the previous oil price boom. Canadian Natural Resources’ ETR fell from 27% to 21%, Cenovus’ fell from 33% to 25%, Imperial’s fell from 24% to 23%, and Suncor’s from 41% to 25%. These companies have all profited from the reduction in Alberta’s corporate income tax rate and the continued subsidies and tax credits that the federal government has offered the industry.
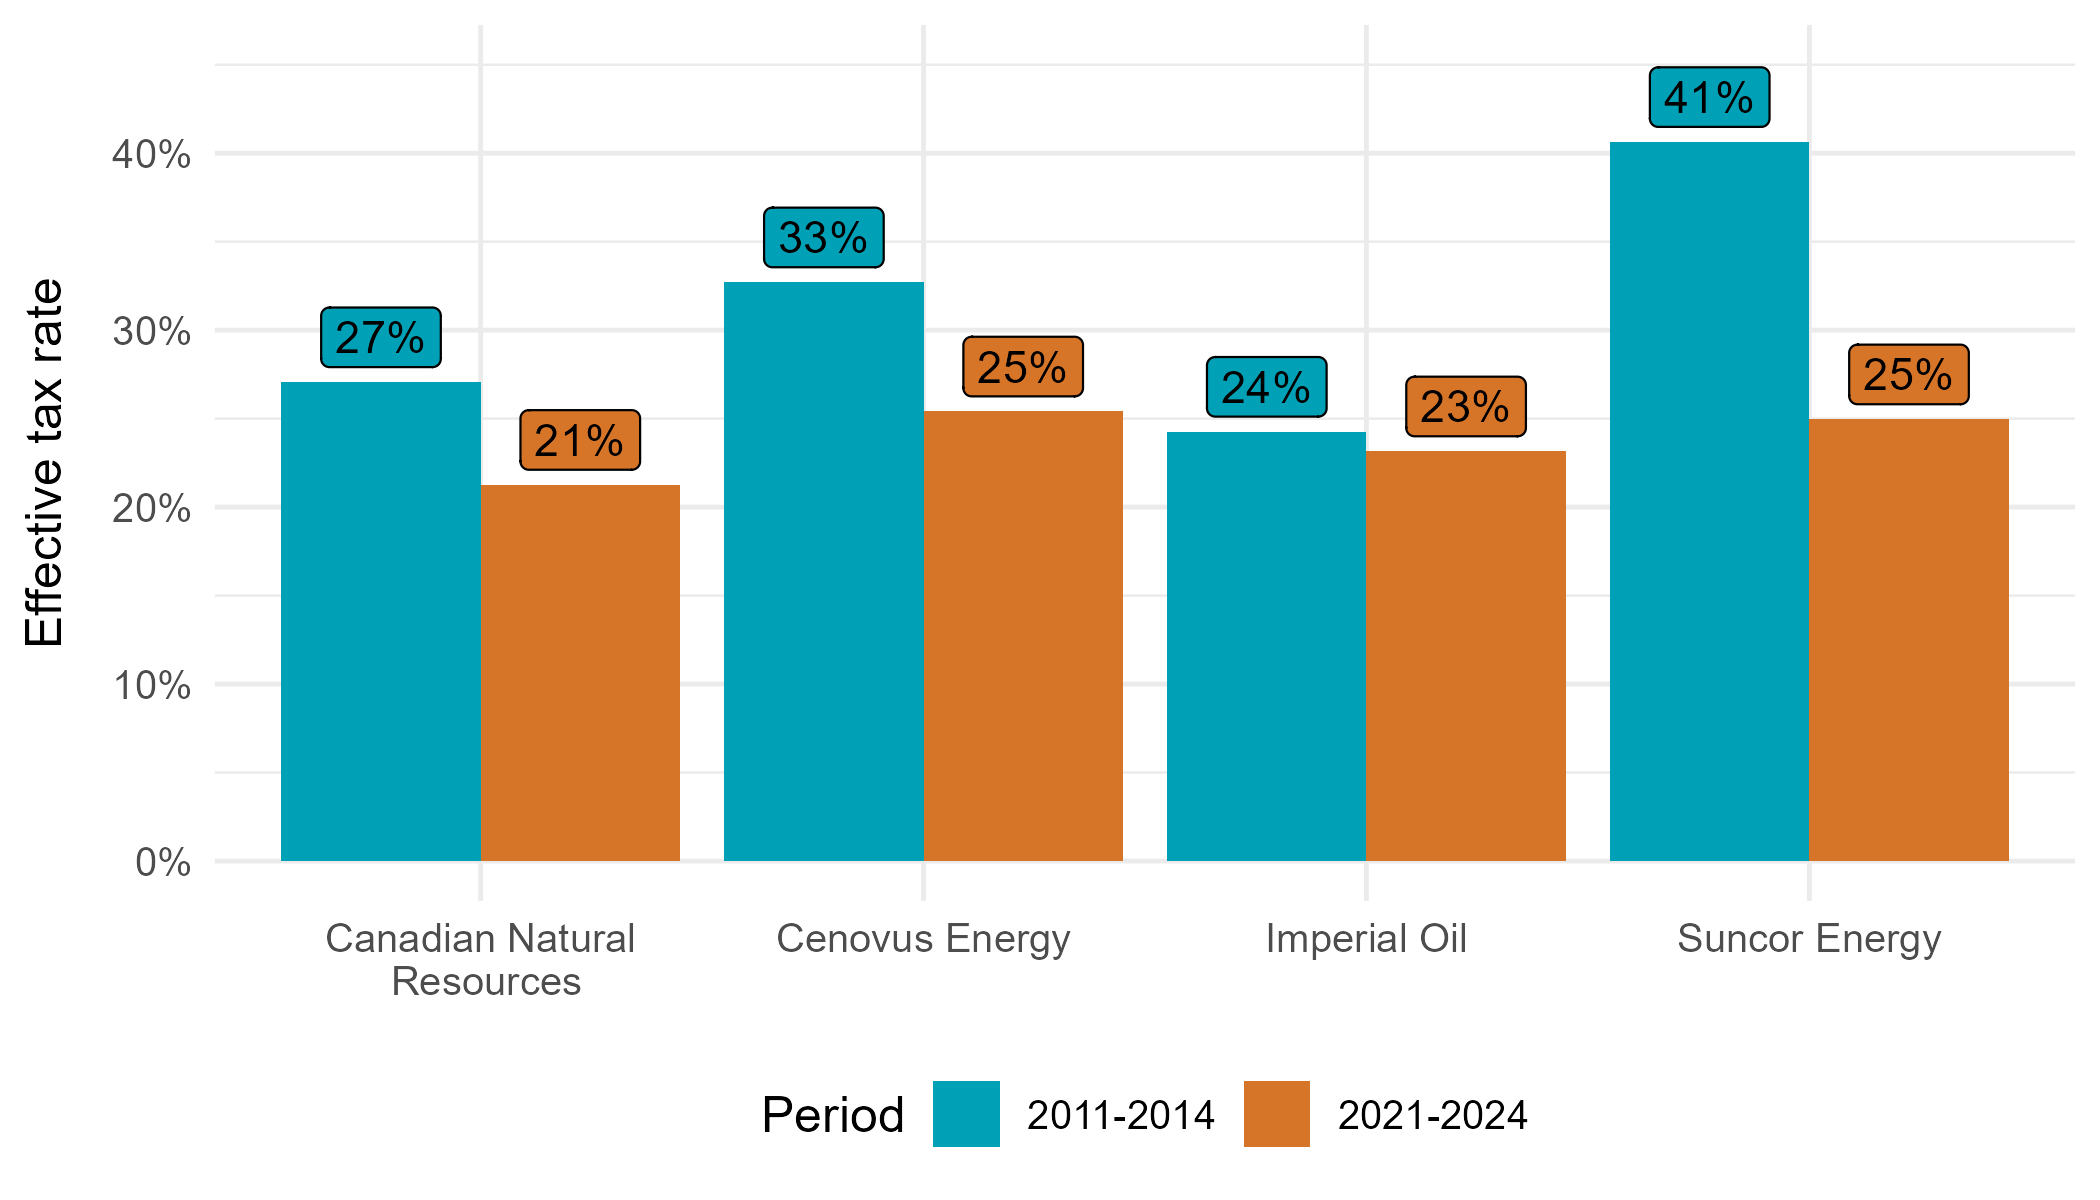
Effective tax rates of the big four oil and gas companies during two oil price booms.
Figure 7. Effective tax rates of the big four oil and gas companies during two oil price booms.
Notes. Authors’ calculations based on firm-level financial data. Effective tax rate = tax expense / pretax income.
Royalties
The other important way that the oil and gas industry contributes to public revenues is through royalties. Royalties are not taxes. Royalties are payments to a government in exchange for the right to access publicly-owned resources – in this case, oil and gas. Corporations do not own Alberta’s oil and gas – Albertans do. Albertans own the resources under their land and can choose what price corporations must pay in order to access their resources.
Across Canada, royalty payments by the oil and gas industry have increased during the recent oil price boom, ranging from $15-34B a year from 2021-2023. During the 2015-2020 period of lower oil prices, royalty payments ranged from $4-10B a year, and during the 2011-2014 boom, they ranged from $12-16B a year. These fluctuations are mainly due to the structure of Alberta’s royalty framework. Alberta’s oil and gas royalty revenue increased from $7.9 billion annually during the 2011-2014 oil price boom to $19.6 billion annually from 2021-2023.
Alberta’s royalty framework for oil sands projects, which now make up the majority of Alberta’s royalty revenues, has two components. Before a project has covered its costs (pre-payout), Alberta receives 1-9% of gross project revenues, depending on the price of oil (at January 2025 oil prices, the royalty rate would be 6.1%). After a project has covered its costs (post-payout), royalties are 25-40% of net revenues, after allowing a return on investment. Most projects are now in the post-payout phase. The combination of more projects being in the post-payout phase and higher oil prices have driven higher royalty revenues.
Higher royalty revenues have clearly benefitted Albertans. Nonetheless, this report has demonstrated that corporate owners, especially foreign owners, have also benefitted enormously from Alberta’s oil sands. As Alberta’s oil sands industry has matured, and now faces new realities as climate change advances, Albertans should once again consider how they want the vast non-renewable resources they own to be used, and who should benefit from them.
Table 3. Average annual royalties and after-tax profits in the oil and gas industry during two oil price booms ($B).
|
Period |
O&G royalty payments |
Alberta’s O&G royalty revenue |
|
2011-2014 |
14.6 |
7.9 |
|
2021-2023 |
24.1 |
19.6 |
Sources. Oil and gas royalty payments from Statistics Canada Table 25-10-0065-01 and Canadian Association of Petroleum Producers. Alberta’s oil and gas royalty revenue from https://open.alberta.ca/opendata/historical-royalty-revenue
Conclusion and recommendations
The recent oil price boom was a huge boon for the owners of Alberta’s oil and gas companies, but not for workers or the public. All of the big four oil and gas companies are majority foreign-owned and much of the profits they collected since 2021 have been sent abroad rather than being kept within the Canadian economy. Unlike during the 2011-2014 oil price boom, there was no surge in employment or spending on labour even though production continued to increase. New investment also remained low since 2021 despite the surge in profits. At the same time, oil and gas prices were the largest contributor to inflation during the post-pandemic period.
The oil and gas industry has become increasingly capital-intensive and concentrated among a few foreign-controlled firms. These conditions strengthen the power of owners relative to workers, and have allowed oil and gas owners to make exorbitant profits since 2021. Without drastic changes to the structure of the industry, further expansion is likely to benefit foreign owners rather than workers as well.
To ensure that Alberta’s economy works for everyone, not just wealthy owners, we recommend:
- A new mission-driven industrial policy. The oil and gas industry has been making record profits without record investments. It does not need public money to fund its proposed pipelines or carbon capture and storage projects. Rather than increasing our reliance on industries that have contributed the most to climate change, the public sector must invest in projects that will benefit Albertans and Canadians economically, and environmentally, for decades to come. These could include constructing a national electricity grid, electrifying transportation, using hydrocarbons to produce materials, or developing a sustainable fuels industry. These projects should be led by the public sector and any public funding for private companies should have strict employment and labour conditions. Estimates suggest that public investments in clean public transportation, a national electricity grid, building retrofits, and climate resilience could generate hundreds of thousands of jobs. These projects could be funded in part through the following measures.
- Conduct a review of Alberta’s royalty framework. The last Royalty Review, completed in 2016, recommended four guiding principles for Alberta’s royalty framework: 1) optimize returns to Albertans, 2) attract investment and promote job creation, 3) support downstream value added industries, and 4) encourage environmental responsibility. With the hindsight provided by the COVID-19 pandemic, the oil price boom, and the subsequent explosion in corporate profits and inflation in Canada, it is time to revisit whether Alberta’s royalty framework is accomplishing these guiding principles.
- Restore Alberta’s corporate income tax rate to 12%, its level from 2015-2019. Alberta currently has by far the lowest provincial corporate income tax (CIT) rate, at 8%. No other province has a rate lower than 11.5%. Research has consistently shown that lower CIT rates do not stimulate investment. Instead, they simply allow corporate owners to keep more of their profits and reduce public revenue. Currently, the oil and gas industry has one of the lowest effective tax rates of any sector of the Canadian economy, in part because it is based in Alberta. Increasing Alberta’s CIT rate would bring the industry’s tax level more in line with the rest of Canada’s economy.
- Implement a permanent windfall profits tax. The post-pandemic inflation surge demonstrated how our economic system can be exploited by large corporations during crises. Large corporations were able to use the disruptions created by the pandemic to raise prices and increase their profit margins, at everyone else’s expense. To prevent oil companies in particular from taking advantage of the crisis, many countries implemented excess profits taxes on the oil and gas industry during the pandemic. Canada has done the same during previous crises. Canada should implement a permanent windfall profits tax that could be triggered during future crises to ensure corporations cannot profit from crises like they did during the pandemic.
Methods
Data sources
Data for this report was retrieved from a variety of sources. In general, industry-level data came from Statistics Canada tables, and firm-level data came from firm annual reports and Compustat. Financial data at the industry level comes from Statistics Canada Table 33-10-0500-01. Royalty payments from the oil and gas industry came from Statistics Canada Table 25-10-0065-01 and the Canadian Association of Petroleum Producers (2023). As of the time of writing, these sources are updated through 2023 so industry-level data in this report uses the period 2011-2023. Foreign ownership by industry comes from Statistics Canada Table 33-10-0570-01 which is current through 2022. Alberta’s royalty revenues were retrieved from the Alberta government website. Employment data was retrieved from Statistics Canada Table 36-10-0489-01.
Firm-level financial data comes from the Compustat North America database and individual firm financial reports. Employment and production by firm were manually collected from annual reports and sustainability reports retrieved from company websites and SEDAR. Firm-level data are available for 2024, so we report results at the firm level across 2011-2024. Husky Energy merged with Cenovus Energy at the end of 2020. To make statistics from 2011-2020 comparable with 2021-2024, Husky Energy’s levels of profits, investment, employment etc., are combined with Cenovus’ for the 2011-2020 period
Net value added
Net value added is a concept that aims to measure the total economic activity generated by an industry that results in an income not needed to replace capital used up in production. It can be expressed as gross value added less depreciation. The sum of net value added across industries equals the net domestic product, while the sum of gross value added across industries equals gross domestic product. This report uses net value added instead of gross value added because it is difficult to define who receives the income that is used to replace depreciated capital, and a key goal of this report is to examine the distribution of value added.
Net value added can be calculated at the industry- or firm-level in two ways. First, there is the output approach which takes the value of all output produced in an industry and subtracts the value of all intermediate goods purchased and all depreciation by the industry. Second, there is the income approach, which involves adding the labour expenses and operating profits of the industry. Typically, these two methods should yield the same results. This report uses the income approach because of data availability limitations. Importantly, royalty payments are considered an intermediate good and hence are not included in value added.
At the industry level, we calculate net value added by summing “Operating profit or loss” and “Labour expenses, total” from Statistics Canada Table 33-10-0500-01. “Operating profit or loss” is equivalent to operating revenue less operating expenses. This concept of profits is used because it most closely aligns with national accounts concept of net operating surplus (depreciation is included in operating expenses). Workers’ share is simply “Labour expenses, total” divided by net value added. The profit share is “Operating profit or loss” divided by net value added.
Unfortunately, Cenovus Energy is the only one of the big four oil and gas companies that has reported its labour expenses separately from other expenses in recent years. Suncor Energy reported labour expenses separately from other expenses up until 2021. For 2022 and 2023, labour expenses are reported combined with contract service costs. We estimate labour expenses for Suncor in these years based on the ratio of labour expenses to contract service costs in 2021. We calculate net value added at the company level for these two firms by summing total labour expenses and operating income after depreciation. Shares of net value added are calculated analogously to the industry-level calculations.
Ownership
Ownership data were compiled from various sources including MarketScreener, Nasdaq, and SEC 13-F filings, and is current to December 31, 2024. The country of each owner is based on the location of incorporation for institutional owners from MarketScreener. Some institutional owners may themselves be owned by residents of other countries but we only consider the location of incorporation. The Li family's ownership of Cenovus Energy is attributed to Hong Kong. Norman Edwards' ownership of Canadian Natural Resources is attributed to Canada. Other individual owners who cannot be identified range from 5% to 32% ownership of these 4 firms. For this portion of ownership, we find the volume of shares traded on the TSX and NYSE for each firm. Then, for the shares on the TSX and the NYSE, respectively, we assume that the distribution of country of origin of individual owners is equal to the proportion of shares traded by Canadians, Americans, and other foreigners on each stock exchange overall. The weighted average is weighted across the four firms by market capitalization in 2024.
