Résumé
Alors que les préoccupations concernant la souveraineté et la résilience économique du Canada s’intensifient, il est essentiel d’examiner non seulement notre indépendance à l’égard des puissances étrangères, mais aussi la concentration du pouvoir économique et politique à l’intérieur même du pays. Étant donné que la richesse et l’influence politique tendent à se renforcer mutuellement, le suivi de la détention de la richesse — et de l’évolution de sa répartition — n’a jamais été aussi crucial pour la santé de notre démocratie et l’avenir du Canada. Les statistiques officielles standards au Canada ne parviennent pas à saisir l’extrême concentration de la richesse au sommet de la distribution. Afin de contribuer à combler cette lacune, le présent rapport fournit de nouvelles estimations de la répartition de la richesse au cours du dernier quart de siècle. En combinant les données d’enquête de Statistique Canada avec des listes de milliardaires, nous estimons la distribution complète de la richesse au Canada de 1999 à 2023.
Nos résultats montrent que :
- Le 1 % des familles canadiennes les plus riches (169 000 familles), disposant d’au moins 7,8 millions de dollars d’actifs par famille, détenait 22,7 % de la richesse des ménages en 2023, comparativement à 19,3 % en 1999.
- De 1999 à 2023, la richesse du 1 % supérieur a augmenté de 3 000 milliards de dollars, tandis que celle des 50 % les moins fortunés n’a augmenté que de 757 milliards de dollars.
- Le 0,01 % des familles canadiennes les plus riches (1 685 familles) détenait en moyenne 448,5 millions de dollars, soit 4 041 fois la richesse moyenne d’une famille appartenant aux 50 % les moins fortunés en 2023.
- Au total, le 0,01 % supérieur des familles (1 685 familles) détenait 756 milliards de dollars de richesse en 2023, soit 4,6 % de la richesse des ménages, comparativement à 131 milliards de dollars, ou 3,4 %, en 1999.
- En 2023, 86 familles milliardaires détenaient autant de richesse que les 6,2 millions de familles les moins fortunées.
- En 2025, la famille résidente la plus riche du Canada était la famille Thomson, avec une richesse combinée de 93,9 milliards de dollars. Elle occupait également ce rang en 1999.
L’analyse des tendances au cours du dernier quart de siècle montre que la concentration de la richesse au sein du 1 % supérieur a augmenté de façon marquée entre 1999 et 2016, avant de diminuer légèrement de 2016 à 2023. Des indicateurs récents suggèrent toutefois une reprise de cette tendance à la hausse : entre le 1er juillet 2023 et le 1er juillet 2025, la richesse des milliardaires résidant au Canada figurant sur la liste Forbes a augmenté de 37,2 %, tandis que la richesse totale des ménages n’a crû que de 9,3 %. Il n’en a pas toujours été ainsi. En remontant plus loin dans le temps, on constate que la part de la richesse détenue par les plus fortunés au Canada a diminué après la Seconde Guerre mondiale jusqu’aux années 1960, parallèlement à des politiques économiques et à des dynamiques politiques qui ont contribué à contrebalancer le pouvoir des personnes ultra-riches.
L’augmentation de la concentration de la richesse est préoccupante pour plusieurs raisons. D’abord, de fortes inégalités économiques sont associées à une influence politique disproportionnée des élites économiques et à un affaiblissement de la démocratie. Ensuite, les inégalités sont liées à de moins bons résultats sociaux et économiques, notamment une diminution du bien-être et de la croissance économique. Enfin, une concentration extrême des ressources économiques signifie que les décisions d’investissement majeures sont prises de manière disproportionnée par un petit nombre d’acteurs puissants, reflétant souvent des intérêts privés étroits plutôt que des priorités publiques définies démocratiquement et visant à répondre aux besoins de l’ensemble de la population.
Pour réduire les inégalités de richesse, il est nécessaire de réformer en profondeur notre régime fiscal afin d’imposer plus efficacement les grandes fortunes et les revenus du capital. Les recettes ainsi générées peuvent servir à financer des investissements publics larges et à rendement élevé, afin de renforcer la résilience sociale et économique du Canada et d’affermir sa souveraineté, notamment : la création d’un réseau national d’électricité propre, la construction de logements abordables hors marché et l’expansion de services universels de garde d’enfants publics. La réduction des inégalités extrêmes de richesse est essentielle pour garantir que ce soient les priorités démocratiques — et non le pouvoir économique concentré — qui façonnent un Canada plus fort, bâti pour tout le monde
Rapport
A quarter century of wealth concentration in Canada
Billionaires. Wealth taxes. Stock market booms and busts. In one form or another, wealth is in the headlines day after day. But what actually is wealth? Who has it and who doesn’t? And why should we care about it?
This report answers each of these questions — we explain the different forms of wealth in Canada and present new time-series estimates of wealth concentration trends in Canada from 1999 to 2023. This helps to address a long-recognized gap in Statistics Canada data, which generally fails to capture extreme wealth inequality at the very top of the distribution. We also explain why extreme wealth concentration matters and why we need to take action.
What is wealth?
In simple terms, wealth (also known as net worth) is the market value of everything someone owns minus their debts. This includes real estate, pensions, the value in a checking account, any businesses, stocks, bonds, and mutual fund shares they own, less any liabilities like mortgages or credit card debt. In total, according to Statistics Canada, Canadian households owned about $16.4 trillion in wealth in Q2 20232. This accounts for the vast majority of the net worth (about 92%) held by all domestic sectors in Canada, with the remainder held by governments, corporations, and non-profits.
We can break aggregate household wealth down into different components: about 60% of wealth is held in non-financial assets, and about 40% is net financial wealth (financial assets less financial liabilities). The vast majority of non-financial wealth is the value of residential real estate assets — 48% being being the value of land under dwellings, 38% being the value of dwellings, with only 14% of household non-financial assets held in other forms (e.g., vehicles, agricultural land). Financial assets primarily include equity and investment fund shares, life insurance and pensions, cash, and deposits. These financial assets are offset by financial liabilities, which are equivalent to about 31% of financial assets.
It’s important to understand these different components of wealth because who owns them is vastly different. 40% of Canadian households held only 4% of financial assets in Q2 2023, while over two thirds of financial assets are held by the wealthiest 20% of households.
On the other hand, the least wealthy 40% of Canadian households held approximately 9% of non-financial assets and the wealthiest 20% held over half. This is because holding significant wealth through one’s principal residence is far more common than owning significant financial assets. But this hides enormous disparities between renters and homeowners, with homeowners holding 10 to 30 times more wealth than renters, depending on the age group. Of course, homeownership is increasingly out of reach for younger families and homeownership rates have fallen since 2011.
Examining the distribution of wealth at the level of quintiles (groupings of 20%), as is possible through publicly available Statistics Canada datasets, hides the vast amounts of wealth concentrated among a few thousand households in Canada. It is important to understand the wealth of the ultra-wealthy because such levels of wealth offer not only the ability to live a life of luxury but the ability to exert power over the lives of others and over the political process.
Why we should care about wealth
Different types of wealth offer different types of power and control in society. For example, homeowners may exert power over local land-use policy to preserve property values, and in large expensive cities, even the seemingly mundane fact of homeowning means access to considerable levels of wealth relative to renters. Whereas owning financial assets at a high enough level — think billionaires — can mean employing thousands of people, access to near-unlimited financing, and access to Canada’s most influential political leaders. In short, expansive holdings of financial assets place the ultra-wealthy on an entirely different plane of power.
Owning small amounts of wealth provides households with an important form of financial security. Households can borrow against their homes or sell assets when in need of additional income. On the other hand, billionaires will never spend the majority of their wealth. Even if one lived a very comfortable life, spending $1,000,000 a year, it would take 1,000 years to spend a billion dollars, even if it accrued no interest (and in reality, with investment returns, the fortune would only keep growing). The scale of billionaire wealth is in another universe from simply living a good or even a lavish life. The defining feature of billionaire wealth is the extreme level of power and influence that flows from commanding such extraordinary levels of economic resources.
Extreme inequality isn’t just unfair — it distorts democracy. The rich have disproportionate influence on public policy because of their structural power. In the U.S., where billionaires are the wealthiest, their political power is most evident — there were 13 billionaires in cabinet or other high-ranking positions in Trump’s second term. In Canada, the power of the rich in our politics is perhaps more outwardly subtle but still ever-present. Technology CEOs have launched lobbying efforts inspired by Elon Musk’s Department of Government Efficiency, and the federal government is moving to embed more corporate leaders in the public service in response.
Companies controlled by the billionaire Irving family have collected tens of millions in government subsidies; just one example of extensive corporate subsidies in Canada. Policies like a wealth tax on the super-rich are never implemented, and efforts to close tax haven loopholes remain fragmented and slow, despite both having overwhelming public support across party lines.
High levels of inequality also weaken economies and harm social well-being. Evidence across rich countries associates higher inequality with worse health and social outcomes, with benefits from greater equality extending beyond low-income groups. A wide range of research (including from institutions like the OECD and IMF) finds that high inequality can lower economic growth and productivity. It can also make growth less stable and less durable, and reduce aggregate demand — because lower-income households are more likely than richer households to spend most of what they earn. At the same time, keeping taxes low on the rich means governments forgo revenue that could fund high-return public investments. For example, evidence suggests investment in infrastructure — including public transit — can boost growth, productivity, and incomes. Research links universal public child care to higher women’s labour force participation with broad economic payoffs.
How wealth is distributed
In Canada, as in most countries around the world today, wealth is extremely concentrated among a few hands and much more unevenly distributed than income. Our new estimates suggest that, in 2023, nearly a quarter of all household wealth (22.7%) in Canada is concentrated among the wealthiest 1% of families. While the median family has only $407,000 in wealth (largely held in their principal residence), the 169,000 wealthiest families in the top 1% have at least $7.8 million. Imagine a Canada where just the residents of London, Ontario owned nearly a quarter of all the country’s wealth. That gives you a picture of the wealth distribution in our country right now.
Notably, ours is likely a conservative estimate of the wealth share of the top 1% (and of the ultra-wealthy more broadly). This is because the Forbes billionaire list data, which we use to make consistent comparisons over the period 1999-2023, is incomplete. Another recent estimate by the Office of the Parliamentary Budget Officer (PBO) finds that the 1% held 23.8% of wealth in 2023.
Measurement of wealth inequality in Canada
Despite the importance of tracking extreme wealth concentration, Statistics Canada does not produce regular estimates of how much wealth the very wealthiest Canadians hold. Quarterly estimates of wealth distribution are only produced at the level of quintiles. The only regular nationally representative survey that gathers data about wealth is the Survey of Financial Security, which is only carried out roughly every three years and fails to adequately capture the wealth of the ultra-wealthy. Because of this shortcoming, researchers have had to resort to a variety of second-best methods to estimate wealth concentration in Canada.
One strand of research, the capitalization approach, uses income tax data to estimate the value of the wealth that generated that income. This method was recently applied by Hempel to estimate the wealth distribution in Canada from 1990 to 2018, and by Statistics Canada for financial wealth in 2019. This method’s strengths include that it relies on actual tax data as opposed to self-reported information and can be calculated more frequently. However, it requires strong assumptions to be made about rates of return on different assets and may not capture offshore wealth held by the ultra-wealthy.
Another strand of research, which this report contributes to, uses an interpolation approach that combines survey data and rich lists from sources like Forbes. Statistics Canada’s Survey of Financial Security gathers self-reported wealth data directly from a nationally representative sample of Canadians, but it fails to properly capture ultra-wealthy individuals. Data on the wealth of ultra-wealthy individuals is gathered from publicly available lists of billionaires and integrated with the survey data using Pareto interpolation. This method can effectively capture the wealth of the ultra-wealthy, assuming that wealth reported on billionaire lists is reasonably accurate. This method has been used by the Parliamentary Budget Office, and academic researchers.
In this report, we adapt the method used by the Parliamentary Budget Office in their 2020 and 2021 reports, and apply it consistently to the 1999-2023 period to examine how wealth inequality has changed over the past 25 years.
In our estimates, the wealthiest 0.01% of families (1,685 families) have at least $155.8 million in wealth and an average wealth of $448.5 million, 4,041 times larger than the average wealth of the bottom half of families. There are nearly 17,000 families with at least $34.5 million in wealth, while the median family has only $407,000. Focusing on billionaires alone, the estimated 86 Canadian-resident billionaire families in 2023 held $286 billion in wealth, as much as 6.2 million families at the bottom of the wealth distribution, and close to the value of all residential land in the City of Vancouver.
Figure 1. Average wealth per family by wealth group, 2023
A typical family in the top 0.01% had 4,041x the wealth of a typical family in the bottom 50%
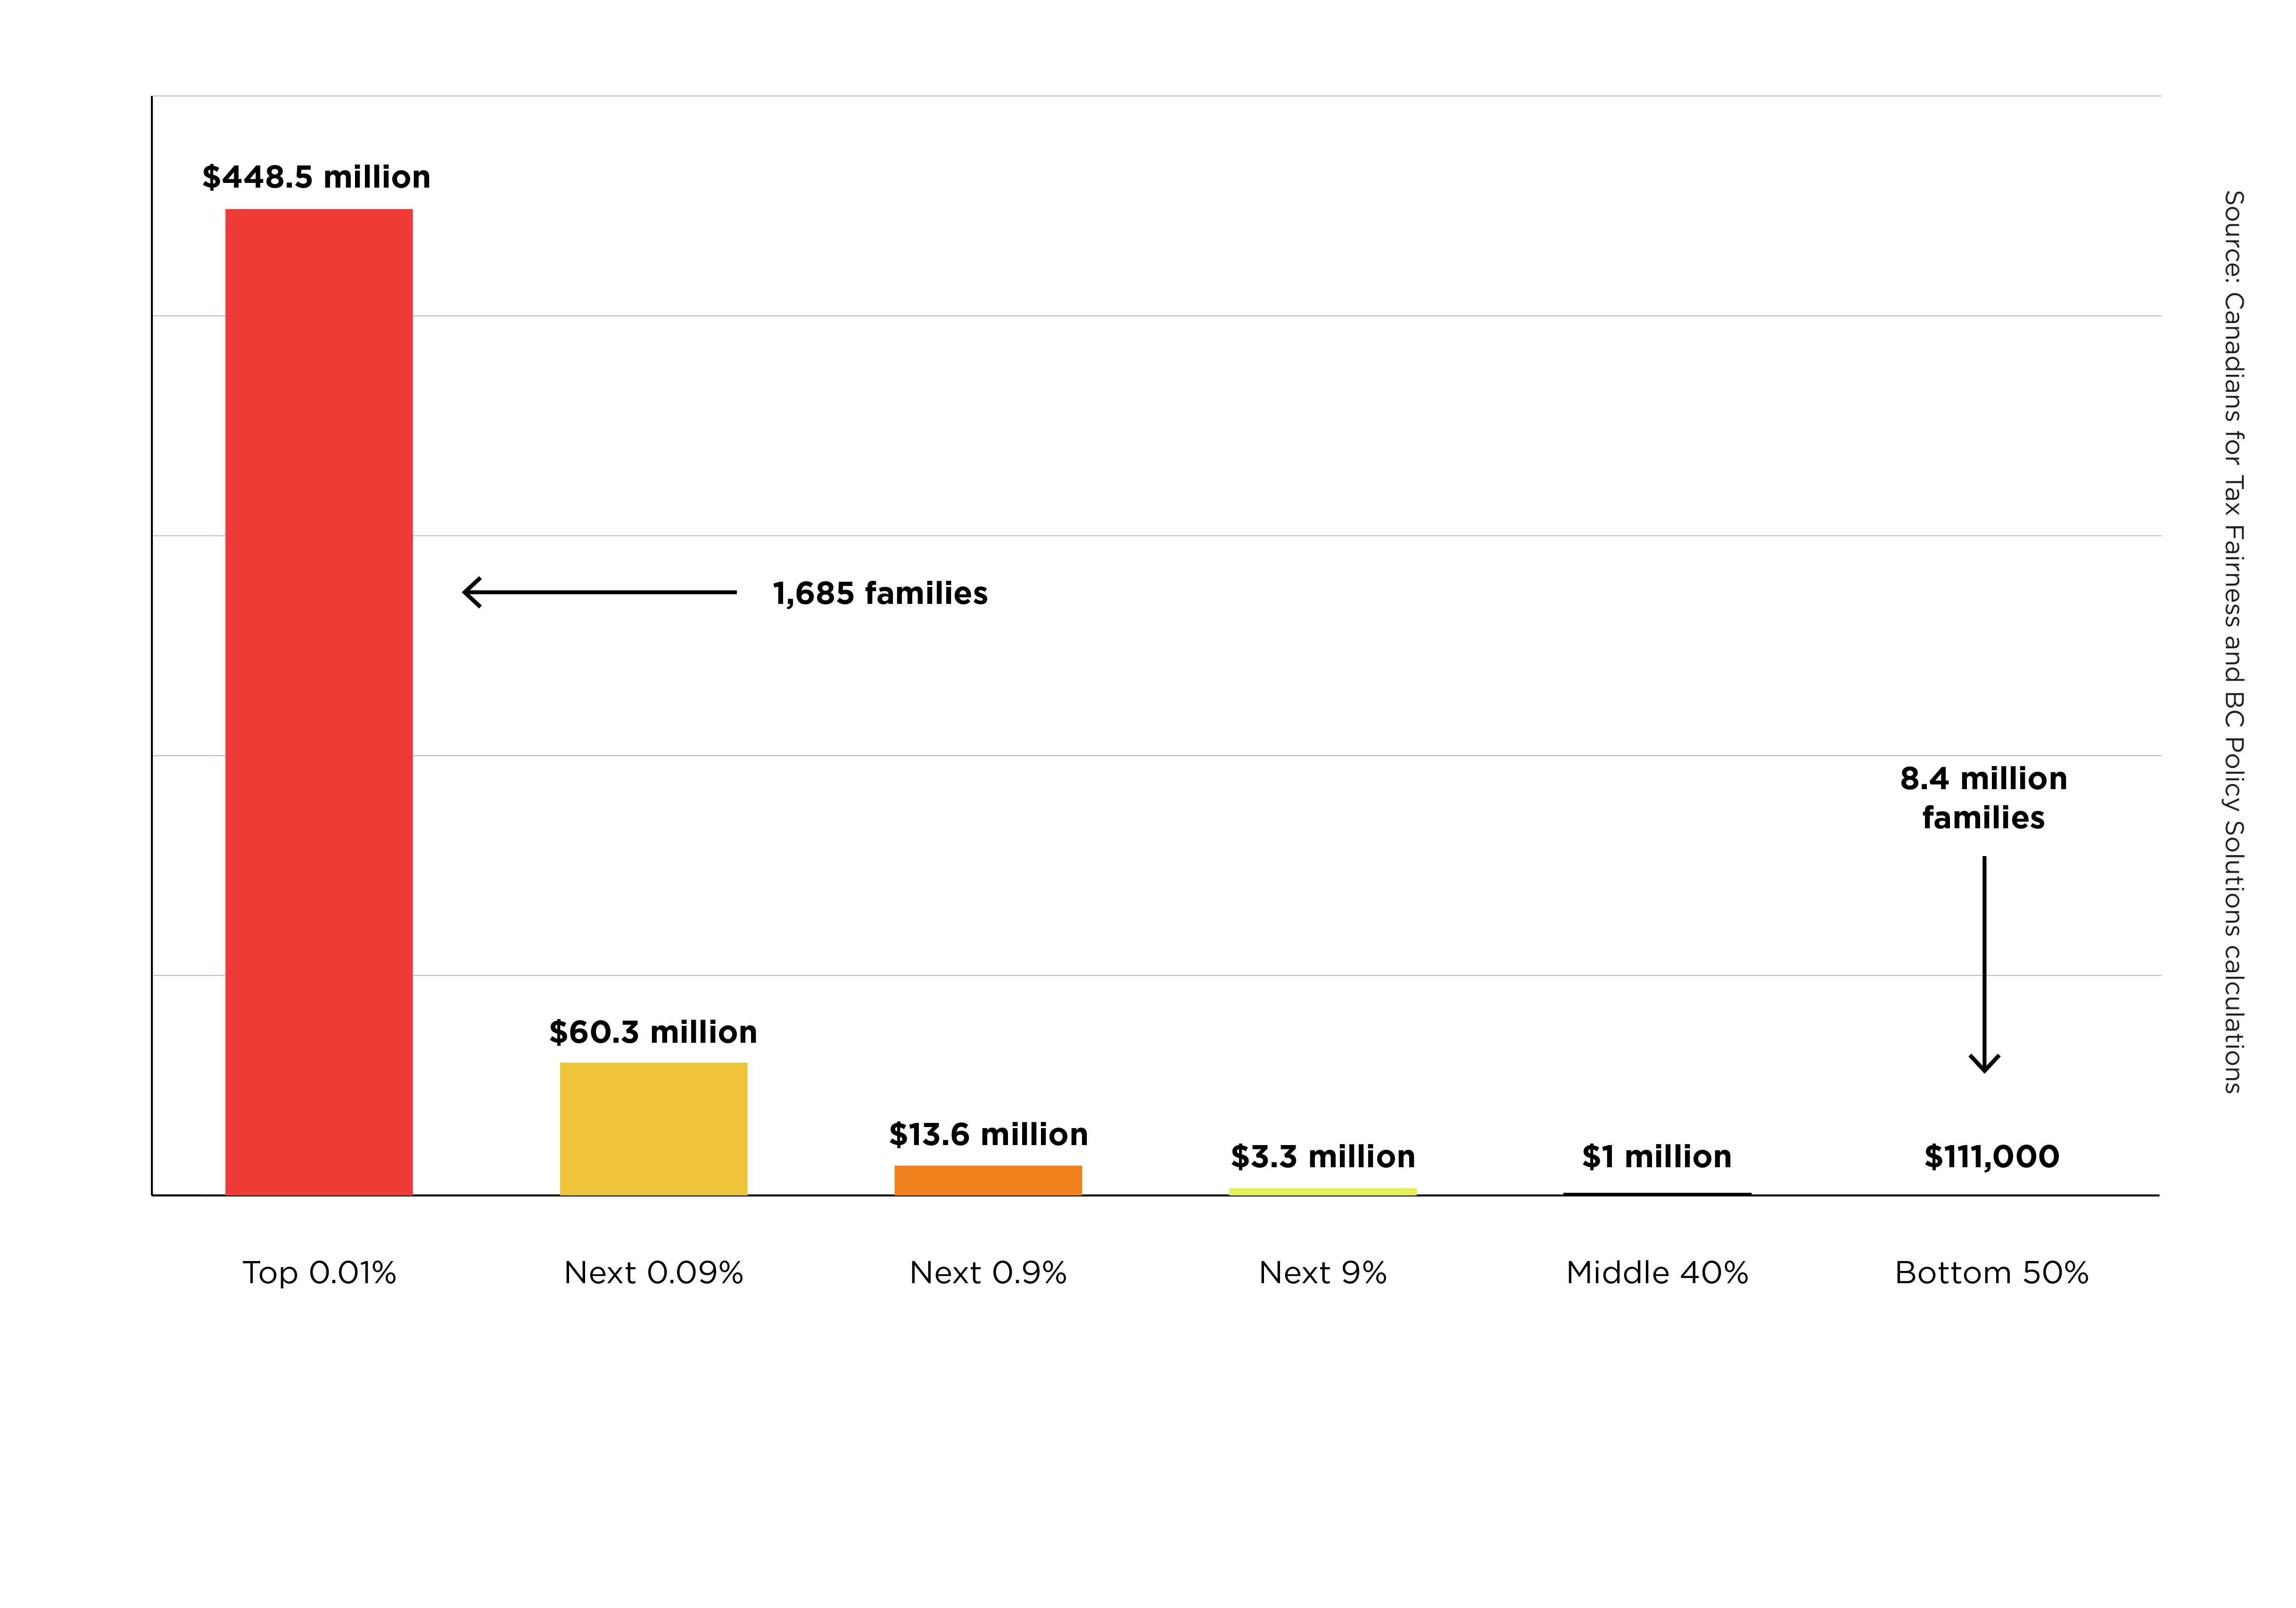
Chart with wealth of top 0.01% in very large red bar, followed by 0.09%, 0.9%, middle 40%, bottom 50%, the latter two essentially forming invisible lines compared to the very large first bar and much smaller second, third, and fourth bars.
Wealth inequality has increased over the past 25 years
It has not always been this way. The concentration of wealth at the very top has increased since 1999. In 1999, the share of wealth owned by the top 1% was 19.3%. In 2023, the wealth share of such families (who in that year had at least $7.8 million in wealth) was 22.7%. The share of wealth of the ultra-wealthiest 0.01% increased from 3.4% to 4.6% from 1999 to 2023. In dollar terms, this change is even more stark. The average family in the top 0.01% had about $340 million more wealth in 2023 (totalling $756 billion) than they did in 1999.
Figure 2. Top wealth shares have increased significantly since 1999
Share of total household wealth among the top 1%, 0.1%, and 0.01%
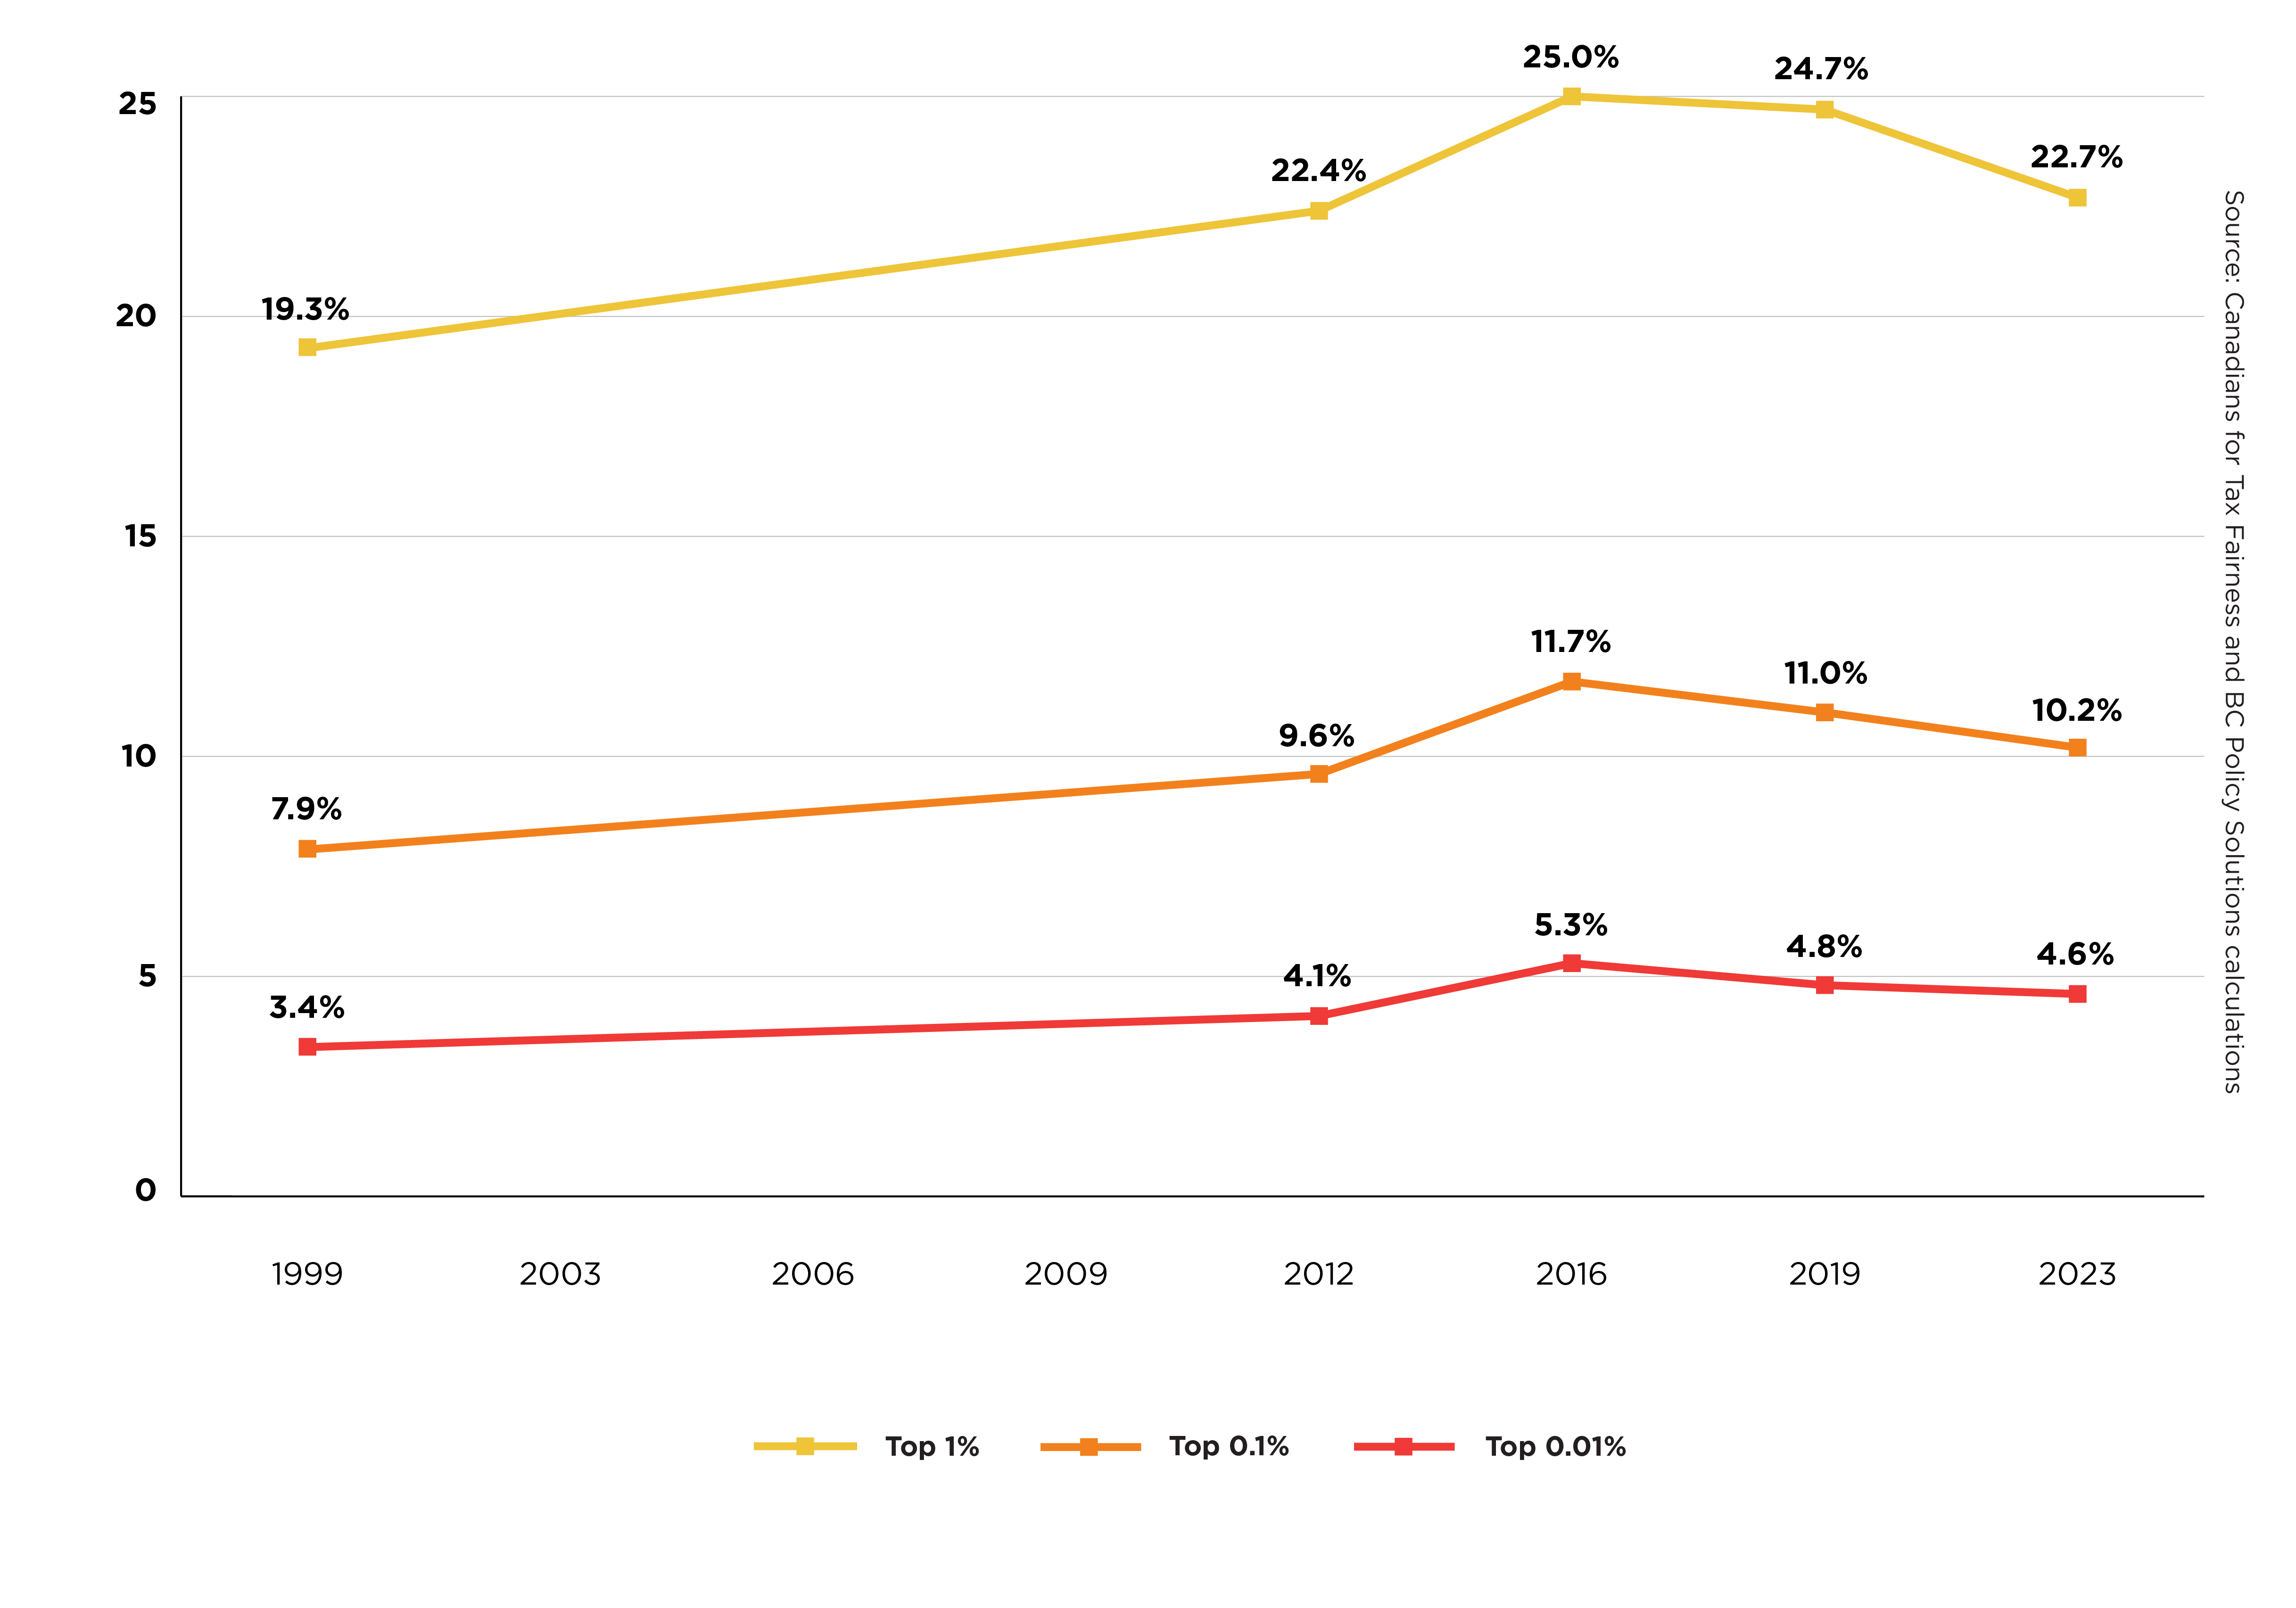
I line chart showing the top wealth shares of the top three percentiles showing a distinct rise in increase starting in 2012.
These trends are broadly consistent with an earlier study that estimated longer-run wealth inequality trends in Canada, which found that the top 1% wealth share increased from 1970 into the 2010s. That study also found that top wealth shares in Canada decreased after the Second World War through the 1960s, coinciding with a period of high marginal income tax rates, limits on capital flows, and growing rates of unionization that helped counterbalance the power of the wealthy.
Increasing wealth concentration over the past quarter century, however, has not been linear. Wealth concentration increased from 1999 to 2016 but actually fell slightly from 2016 to 2023. While this trend is encouraging, we should not expect the fall in wealth concentration to continue. Although there is not yet survey data available for 2025 that would allow us to estimate the full distribution of wealth in 2025, there are some numbers we can examine to get a sense of the latest trends.
From July 1, 2023 to July 1, 2025, the billionaire wealth of Canadian residents on the Forbes list increased by 37.2%. Over the same period, total household wealth increased by only 9.3%.41 Another indicator is the trajectory of housing prices. During the pandemic, housing prices increased drastically, inflating wealth for many homeowners. Housing prices began to flatten in 2022 and were actually lower in July 2025 than they were in July 2023, suggesting that the wealth of most households has increased little over this period compared to the rising wealth of billionaires, which is mostly financial wealth. Although we’ll have to wait for more detailed statistics to be released, wealth concentration may well be increasing again.
Why is this happening?
While there is no single agreed-upon explanation for the increase in wealth concentration at the very top over the past couple of decades, a few important factors are worth considering. First, it is well known that larger fortunes tend to earn higher returns on their wealth than smaller fortunes. People with large fortunes have access to a wider range of investment opportunities, can take on greater risks, and, when they have direct control of large companies, may be able to use their power to earn higher returns than competitors. This means that the wealth of those with the very highest levels of financial assets tends to grow faster than the wealth of those who have fewer financial assets. Canada’s richest family, the Thomsons, are one dramatic example of such disproportionate growth, as their wealth increased fivefold from October 2012 to July 2025.
Figure 3. Thomson family wealth has quintupled since 2012
Increase was driven by skyrocketing Thomson Reuters share price
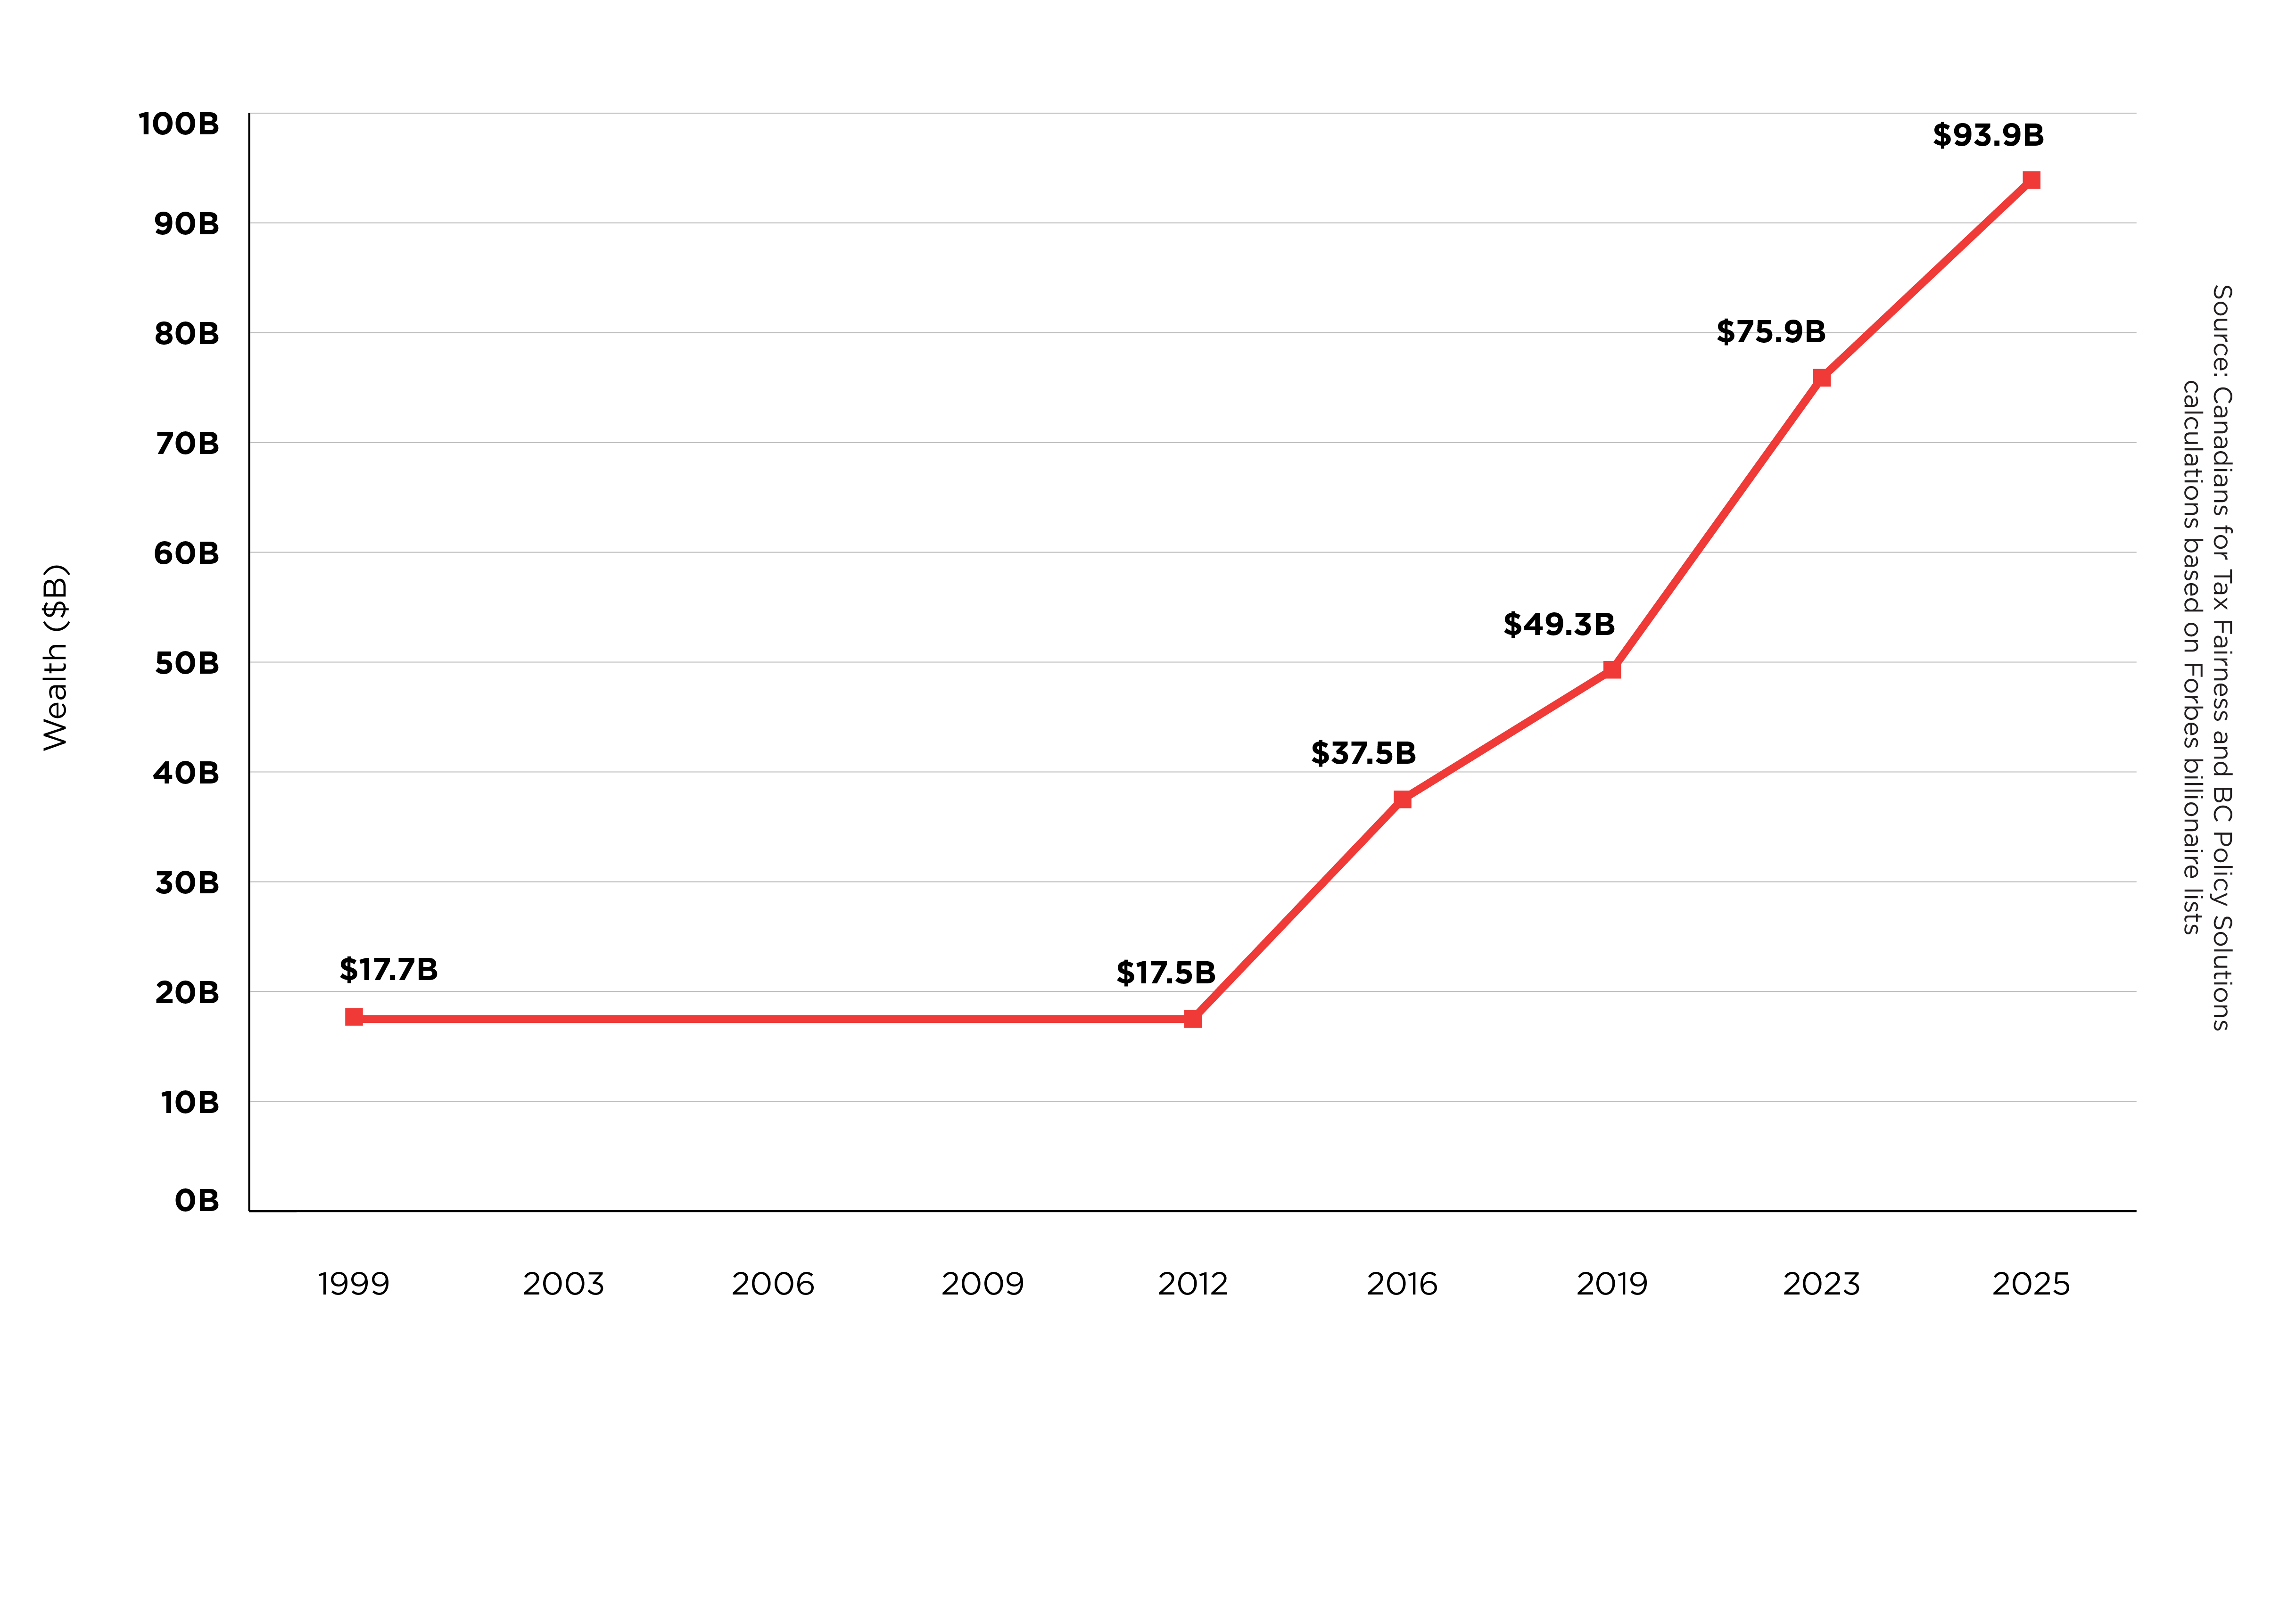
A line chart showing a sharp rise in wealth accumulation of the Thomson family starting in 2012.
Second, the increase in wealth concentration is very likely, in part, a result of a suite of neoliberal policy changes that were made in the late 20th century. Free-trade agreements that empower capital over workers, attacks on workers’ rights, the approval of corporate mergers, large reductions in top marginal income tax rates from post-war highs, and the privatization of public services have all contributed to empowering people who already own wealth over others. These changes tend to increase financial asset values because markets predict that owners will be able to keep more revenue for themselves instead of sharing it with workers. Indeed, rising wealth concentration has been accompanied by an increasing income inequality at a global scale over the past 40 years.
These trends are not unique to Canada. The United States, which enacted similar neoliberal reforms in the 1980s and 1990s, has had an even larger rise in the share of wealth owned by the top 1%. Because Canada’s economy is heavily integrated with that of the United States, and the global economy as a whole, American and global trends affect Canada. Increasing integration with the United States has given Canada’s wealthy elites more power to increase their wealth because it has made it easier for them to threaten to move their wealth south of the border if Canada challenges them in any way.
Finally, contrary to the popular myth that Canada is a land of equal opportunity, Canada has no mechanism to prevent extremely concentrated wealth from being passed down across generations. In fact, Canada is the only G7 country without an inheritance tax. This means that heirs of families with huge fortunes never have to work a day in their lives, while millions of Canadians struggle to afford a place to live.
Conclusion and policy recommendations
Canada has a wealth concentration problem. Extreme wealth concentration comes with extreme concentration of control over the economy and control over the jobs and livelihoods of thousands of Canadians. Controlling billions in wealth is associated with huge inequalities in power and influence over our political process.
The trajectory of the United States as a society should be a dire warning for Canada. Runaway wealth concentration has resulted in billionaires exerting extraordinary influence over the political process, with President Trump having selected 13 billionaires for top roles in his administration. If Canada does not want to follow in America’s footsteps in allowing a few ultra-wealthy families to dominate our economy and our political process, we need to implement policies that put us on a different path. We should start by properly measuring wealth concentration. Statistics Canada should publish regular estimates of extreme top-end wealth concentration so that we can have an informed public conversation about the distribution of wealth.
To prevent further wealth concentration, we should implement a wealth tax targeted at the ultra-wealthy. It is estimated that an annual tax of 1% on net wealth above $10 million (affecting just 0.6% of families), 2% above $50 million, and 3% above $100 million would raise an estimated $39 billion in its first year alone (rising in subsequent years) and could raise $495 billion over ten years.51 This is even after accounting for behavioural responses like tax avoidance and evasion. Under the same modelling assumptions, a 3% tax on billionaires alone (specifically, the portion of their wealth above $1 billion) would raise $5.8 billion in its first year.
An inheritance tax would prevent concentrated wealth from being passed down indefinitely. As mentioned earlier, Canada is the only G7 country without an inheritance or estate tax. It is no wonder, then, that the Thomsons, Canada’s richest family in 1999, remain Canada’s richest family today (the patriarch Kenneth Thomson, who himself inherited his fortune from his father, passed away in 2006, absent an inheritance tax in Canada). The UK levies an inheritance tax of 40% on inheritances above £325,000, which is projected to raise 0.7% of government revenue in 2025-26,53 equivalent to $3.6 billion in revenue for Canada. Similarly, the US has an estate tax of 40%. Despite the fact that very few families pay it today, it still contributes 0.6% of government revenues (down from 1.5% in 2000).
Capital gains tax reform would end the unfair special treatment of capital gains income (accrued mostly by the richest Canadians), which is currently taxed at half the rate of income from wages and salaries that working people earn. This tax break for the rich means forgoing a projected $30 billion in federal government revenue in 2025 and more in provincial and territorial revenue.
While tax policy is only one lever for change, reforms of this kind are crucial steps towards curbing extreme wealth concentration, rebalancing power in our economy and democracy, and preventing the kind of slide into oligarchy we are witnessing in the United States. These types of tax reforms also have the potential to raise considerable amounts of revenue that can be invested in the public good, addressing many of the major societal challenges of our time. Indeed, a wealth tax alone could fund a whole suite of transformative national projects, including enabling 100,000 new non-market homes per year, building a national clean electricity grid, delivering more reliable and affordable public transit, vastly expanding affordable public child care spaces, and broadening public dental and pharmacare plans.
To be sure, enacting a policy agenda of this kind would require growing the power and mobilization of working people, including strengthening workers’ ability to organize in unions and counter the growing economic and political power of extreme wealth. To protect our democracy, bolster our economic resilience, and preserve our sovereignty, Canada must act now to limit and reverse extreme wealth concentration.
APPENDIX
Methods
To construct our estimates of wealth inequality in Canada, we replicated the methods used by the Office of the Parliamentary Budget Officer (PBO) to construct the High-net-worth Family Database (HFD), described in their 2020 and 2021 reports. In general, we relied closely on the methods outlined in the Appendix of the 2020 report. As the PBO reports, we relied on three principal data sets: public use microdata files from the Survey of Financial Security (SFS), national balance sheet accounts, and rich lists. In order to construct an estimate that was consistent across the five years with reliable SFS data (1999, 2012, 2016, 2019, and 2023), we relied on Forbes billionaire lists as our rich lists. The unit of analysis is the “family unit”, which includes economic families and individuals not in economic families. Wealth is defined as the money a family would have if it sold all its assets at market value and paid off all its debts.
In short, our method entailed the following (for more details, see the PBO’s 2020 report): We scaled SFS observed wealth and debt values so that aggregate values matched NBSA aggregates for the same quarter. Then, we added the corresponding Forbes rich list with non-residents removed and wealth converted to CAD using Bank of Canada exchange rates. Next, we created a synthetic dataset between the bottom of the Forbes rich list and the top of the observed wealth values in the SFS using Pareto interpolation. Finally, we iterated the above steps until the total wealth and liabilities in our dataset matched those in the NBSA. Our method differed from the PBO’s 2020 report in a few ways, which are outlined below:
For Forbes list entries that combine a billionaire and their family, we split their wealth into three constituent family units, following Davies and di Matteo (2020). We tested the sensitivity of top shares to this assumption and found that splitting families into one, two, or four (as opposed to three) family units had very little effect on top shares.
National Balance Sheet Accounts are revised regularly. We use the values published on December 11, 2025, which differ from those used in the PBO’s (2020) report.
When observations with large weights lie on the threshold of wealth groups, we split them so that exactly X% of families are in the top X% wealth group. Our estimates of top 1% shares are within 0.3 percentage points of those estimated by the PBO for 1999, 2012 and 2019 in their 2021 report, indicating our success in replicating the PBO’s method. For 2016, there is a discrepancy of 2.3 percentage points. This may be due to differences in the inclusion of non-residents or the use of a Forbes billionaire list from a different date. The PBO used a revised methodology in their 2025 report, but did not explain the differences in enough detail for us to explain the differences between their revised estimates and our estimates (nor the differences with their earlier estimates).
Limitations
There are a few limitations to our methodology that should be noted. First, our estimates of the distribution of wealth are very sensitive to the coverage and accuracy of the Forbes rich lists. If the Forbes list is not exhaustive of Canadian resident billionaire families, then we will underestimate the Pareto parameter that gives shape to the top of the distribution, and therefore underestimate the wealth concentrated at the top. There is some evidence that this is the case because the Forbes billionaire list is missing some families listed on other available billionaire lists. For example, the Forbes 2023 list is missing the Weston, McCain, Rogers, and Desmarais families, which are included on Maclean’s magazine’s 2024 list of the richest Canadian families. The PBO estimated the wealth distribution using both Forbes and (in years they were available) Canadian Business and Maclean’s magazine rich lists and got higher estimates of top wealth shares when using the latter, more exhaustive lists. Relying on Forbes may lead to our estimates slightly underestimating top wealth concentration. We rely on Forbes lists because, unlike the other rich lists, they are available for each year in which we have SFS data. On the other hand, our estimates may also be biased if Forbes valuations are systematically too high or too low.
One other limitation is that we rely on public use microdata files (PUMFs) rather than the raw survey data from the Survey of Financial Security. PUMFs are subject to top-coding, which could bias our estimates of the top of the wealth distribution. The PBO compared estimates of top shares using PUMFs and the raw microdata for 2019 and 2023 and found that the “differences are usually not large”. Hempel (2025) found that top-coding had a greater influence on top wealth shares for the 1999 SFS PUMF than in the later years in our sample. For this reason, as a robustness check, we created a modified 1999 SFS PUMF where the top 1% share matched that reported for the microdata. In the robustness check, using this modified PUMF increased the final estimated top 1% share by about 0.3pp in 1999.
Author bios
Silas Xuereb is an economist and policy analyst at Canadians for Tax Fairness. With years of experience in academia and working with non-profit organizations, he is passionate about conducting rigorous research to understand social and economic inequalities in support of actors working to alleviate them. He holds Master’s in Economics from UBC and the Paris School of Economics and is currently a PhD student at UMass Amherst.
Alex Hemingway is a senior economist and public finance policy analyst at BC Policy Solutions. His research focuses on public finances, housing, inequality, taxation policy and tax fairness, public services and democratic innovation in BC and Canada. He comes to BC Policy Solutions after working at the Canadian Centre for Policy Alternatives – BC Office since 2016. Alex earned a PhD in political science from the University of British Columbia with research on the relationship between economic class and political inequality across developed democracies. He holds two master’s degrees from the London School of Economics (MSc Social Policy and Planning; MSc Global Politics).
About Canadians for Tax Fairness
Canadians for Tax Fairness is a non-profit, non-partisan organization that advocates for fair, progressive tax policies in order to build a strong, sustainable and equitable economy, and support quality, well-funded public services.
About BC Policy Solutions
BC Policy Solutions is an independent, non-partisan research institute committed to advancing transformative policy solutions to the most pressing challenges facing people in British Columbia. Through research, convening and public engagement we seek to build a more just, equitable and sustainable future for all.
