Summary
Pharmacare is high on Canada’s political agenda with the federal government’s Advisory Council on the Implementation of National Pharmacare led by Dr. Eric Hoskins set to report by spring 2019. Pharmacare is also expected to be a key issue in the 2019 federal election.
It is well-established that a universal (single-payer) national pharmacare program could achieve huge economy-wide savings while significantly increasing access to prescription drugs, in particular for those who do not currently have a private or workplace drug plan. However, implementing such a program would also involve a significant shift in spending from the private sector to government.
A range of policy options have been proposed to finance a universal (single payer) national pharmacare program should the federal government decide that additional fiscal capacity is required. Our analysis assesses these various options to determine which are the most fair and equitable, and how we can best share and distribute the considerable savings that would be generated by the introduction of a national pharmacare program.
We adopt relatively modest estimates for the net savings that would be achieved by a universal national pharmacare program. These estimates are based on the Parliamentary Budget Officer’s (PBO) assessment of what governments, individual Canadians and employers are expected to pay for prescription drugs in 2020 and what those costs would be under a national pharmacare program consistent with Quebec’s current formulary.1 We then adjust the PBO estimates to better match Statistics Canada’s tax modeling software, which has the effect of increasing both the economy wide savings of a national pharmacare program and the cost to the federal government of implementing it compared to the PBO estimates.
Based on these calculations, we find that a federal universal (single-payer) pharmacare program would reduce spending on prescription drugs by individual Canadians and employers by $16.6 billion annually with an additional cost to governments of $10.4 billion a year, resulting in overall net savings of $6.1 billion annually, equivalent to over $160 per person in Canada. The question then is how to raise the revenues needed to pay for universal pharmacare, and how to equitably distribute the savings across the population.
Aiming for fairness and greater equality in the way we pay for public pharmacare is important in its own right. A fairer, universal pharmacare system will also be more politically attractive and come with important social and health benefits associated with lowering the cost of pharmaceuticals for lower- and middle-income households. Paying for pharmacare in a way that increases inequalities or introduces a piecemeal system to fill current gaps in coverage would undermine these added benefits of national pharmacare.
This paper examines seven different tax-based revenue generating options the federal government could use to equitably raise the estimated $10.4 billion required to pay for a universal national pharmacare program in 2020. We then estimate what the net financial impact of those tax measures would be on households of different income levels and types.
To calculate those impacts, we use Statistics Canada’s tax modelling software, the Social Policy Simulation Database and Model (SPSD/M), and other data sources to weigh the savings households would achieve under a universal pharmacare plan — e.g., from lower out-of-pocket spending on prescription drugs and lower private health care premiums — against various modest tax increases. We do the same analysis for employers and governments at an aggregate level.
The following seven relatively straightforward revenue-generating options are considered as ways the federal government could raise $10.4 billion annually for a national pharmacare program:
- Increasing the federal Goods and Services Tax (GST) rate by 1.5 percentage points (from 5% to 6.5%);
- Increasing the general corporate income tax (CIT) rate from 15% to 20.25%;
- Increasing all personal income tax (PIT) rates by 1.8 percentage points, except for the lowest bracket;
- Introducing a flat 1.1% payroll tax, split between employees and employers, with a $10,000 exemption;
- Closing tax loopholes, specifically increasing the capital gains inclusion rate from 50% to 75%;
- Combining a 2 percentage point increase to corporate taxes and a 1.2 percentage point increase to personal income tax rates, again excluding the lowest bracket; and
- Combining a 0.5 percentage point increase to the GST rate, a 1.8 percentage point increase to the corporate income tax rate and a 0.6 percentage point increase in all personal income tax bracket rates except the lowest one.
For each scenario, we determine how the anticipated $6.1 billion in net savings resulting from a new pharmacare program would be distributed between households, employers and provincial governments. We also determine the distribution of net savings from pharmacare across the income spectrum to see if that distribution is progressive, i.e., where more of the benefit goes to low- and middle-income families compared to wealthier households.

No matter the scenario, households and employers will save from much lower drug costs, but they will also pay more in new taxes. The net savings for each sector (the difference between the two values) are summarized in Table 1.
National pharmacare clearly produces substantial savings, which households can benefit from in a very tangible way. In almost all of the scenarios, middle class households see the largest annual net benefits — in the $400 to $500 range — while lower income households end up between $300 and $400 better off on average than they were without pharmacare. These savings are possible at the household level even while employers are saving between $1 billion and $3 billion a year depending on the tax measures introduced.
The most regressive option for funding pharmacare (i.e., the one providing the least savings to low- and middle-income families) is the GST increase. If the federal government paid for pharmacare this way, the net savings for the middle class and lower income families would be at or under $100 per household. In some cases, such as for households in the fourth decile, there would be no savings at all. Upper-middle income and upper-class households would end up paying more in the GST scenario.
The windfall savings from a GST-funded pharmacare program would go to employers. Not only do they save from lower drug insurance premiums as the federal government absorbs those costs, but employers do not pay GST. As a result, employers would be $5.6 billion better off in 2020 under the GST option.
The most progressive ways of distributing pharmacare savings are through taxing capital gains, increasing personal income taxes, increasing corporate taxes, or through a hybrid approach involving personal and corporate tax increases. In all four of these cases, middle class and lower income deciles see average net benefits of between $300 and $600 on average per household.
Options where both households and employers contribute — through payroll taxes, increasing the capital gains inclusion rate and hybrid options — result in more equitable cost-sharing between sectors at an aggregate level. The higher savings for lower income households in these scenarios result from corporations taking on a larger share of pharmacare costs, the progressive nature of the personal income tax system and the concentration of capital gains among Canada’s wealthier households.
In most scenarios, provincial governments also stand to capture small amounts of the pharmacare savings due to secondary tax implications. The only exception is in taxing capital gains where the provinces would capture almost a third of the savings from pharmacare. In this scenario, additional measures, including tax changes, may be necessary to make sure the gains remain mostly within the private sector.
This report shows that a truly universal pharmacare program is achievable using a variety of modest tax measures that would result in the equitable distribution of drug cost savings. There is no justification for a diluted or fill-the-gaps alternative that would neither achieve the same beneficial health outcomes nor the degree of savings for Canadian families and the economy as a whole.
The federal government can safely and affordably follow the advice of numerous experts to introduce a comprehensive, public pharmacare program. This program could be paid for in a progressive way that reduces inequalities and significantly improves the well-being of a majority of Canadian households. All we need now is the political commitment to move forward and turn this historical opportunity into reality.
Report
Authors: Toby Sanger & David Macdonald (CCPA)
INTRODUCTION
Pharmacare is high on Canada’s political agenda with the federal government’s Advisory Council on the Implementation of National Pharmacare led by Dr. Eric Hoskins set to report by spring 2019. National pharmacare was a top priority at the 2018 federal Liberal policy convention and some say it will be the defining issue of the 2019 election.2 The NDP has long supported the establishment of a national pharma care program.
This strong, cross-partisan support for pharmacare is not surprising. If designed correctly, a national pharmacare program will significantly improve health outcomes, be good for the economy and save Canadians billions of dollars a year in prescription drug costs. As the Institute of Fiscal Studies and Democracy (IFSD) concluded recently:
the time has come for Canada to join other OECD countries that offer pharmacare as part of a single-payer, universal health care system. Federal politicians and Canadian Premiers must seize this historic opportunity to support Canadians’ health and well being from coast to coast to coast.3
Numerous studies have shown that while a universal pharmacare program would result in huge net health care savings compared to our current system, it would also involve a significant shift in spending.4 Households and employers would save substantially in out-of-pocket costs and insurance premiums; government spending, on the other hand, will need to increase, albeit by a lesser amount.
At the same time, most of these analyses do not account for the additional dynamic benefits for employers, households or governments. For example, a national pharmacare program could help improve labour mobility and reduce the “welfare wall”: lack of drug coverage for low income workers is often the main obstacle for people on social assistance who want to go back on the labour market.
This report does not present any new estimates of the aggregate costs or savings from introducing a national pharmacare program. Instead, we analyze various financing options that have been proposed should the federal government decide that additional fiscal capacity is required, and determine which options are the most fair and equitable.
Our analysis examines the distributional impacts of these various financing options to determine how different sectors and households of different income levels and types would benefit — and in some cases where they will pay more — from a new pharmacare plan. We also consider how provincial government revenues may change under different scenarios.
There are several reasons why we should aim for greater equity in the way we pay for public pharmacare and how we share the savings:
- Greater equity is important not only for social reasons:5 Lower rates of poverty and greater equality are associated with better population health, as well as a host of other positive social outcomes.
- There will be greater public and political support for a program that results in more equitable outcomes.6
- It should be more feasible to introduce and implement a program that shares the savings more equitably and does not result in large windfall gains for any one group, such as larger businesses or governments.
- Growing inequalities have negative economic as well as social consequences, resulting in increased fragilities and slower growth.
Of course, there are other factors to consider when choosing the appropriate financing option for a national pharmacare program, including the economic and employment impacts, how different employers will be affected, and how to minimize the number of individuals and businesses who would be worse off. Still, our view is that equity concerns should be a top priority. Our numbers suggest this can be accommodated, in a highly cost-effective way, into a new pharmacare plan.
This report is organized into the following four parts:
- First, we summarize current aggregate levels of spending on prescription drugs and the projected costs and savings to households, business and government from introducing a national pharmacare program.
- Part two assesses current household spending on prescription drugs and private health care plans, and describes how this spending varies among different household income groups.
- In part three we propose different ways the federal government could generate the $10.4 billion we estimate it will require annually to fund a national pharmacare program, and how provincial government revenues will be affected.
- Finally, part four assesses the net financial impact of each of these financing options on households of different income groups and types.
Part 1
COSTS AND SAVINGS OF A NATIONAL PHARMACARE PROGRAM
Estimates of net overall savings from the introduction of a universal and comprehensive pharmacare program range from $4 billion to $10 billion a year — the equivalent of between 10% and over 40% of the $34 billion that Canadian households, employers and governments currently spend on pharmaceutical drugs each year (not including hospitals).7
The difference in estimated savings depends in particular on the number and types of drugs that are proposed to be covered under a national pharmacare program (i.e., the formulary) and how aggressive governments are in negotiating lower drug costs. A program with limited drug coverage and weaker cost controls over drug prices would save less money, while a comprehensive program with stronger cost controls could save considerably more.
This analysis adopts relatively modest estimates for the net savings that would be achieved by a universal national pharmacare program. We base our numbers on the Parliamentary Budget Officer’s (PBO) estimates of what governments, individual Canadians and employers are expected to pay for prescription drugs in 2020 and what those costs would be under a national pharmacare program consistent with Quebec’s current formulary, with no user fees or co-payments other than a $5 surcharge when users request the name brand version of an available generic drug.8
We then adjust the PBO estimates to better match Statistics Canada’s tax modelling software. (See Appendix D for a reconciliation of the PBO and Statistics Canada datasets.) This adjustment has the effect of increasing both the economy-wide savings of a national pharmacare program and the cost to the federal government of implementing it compared to the PBO estimates.
As summarized below, a federal universal (single-payer) pharmacare program would reduce spending on prescription drugs by individual Canadians and employers by $16.6 billion annually at an additional cost to governments of $10.4 billion a year, resulting in overall net savings of $6.1 billion annually, equivalent to over $160 per person in Canada.
Table 2 shows that households and employers (lines 1 and 2) will spend $17.1 billion on prescription drugs that would be covered, in the PBO formulary, by a national pharmacare plan in the year 2020. This amount includes out-of-pocket deductions and co-payments paid by households, but also indirect costs such as health care premiums paid by both employers and households. Another $3.9 billion would be spent on prescription drugs not covered by a pharmacare plan (lines 6 and 7).

Source: Parliamentary Budget Office and author’s calculations. See Appendix D.
The impacts of a national pharmacare program on employers are discussed generally later on, though data collection issues examined in Appendix C limit a more thorough analysis. For now, we assume that cost increases to businesses could be addressed in three broad ways: by increasing prices, by decreasing payrolls or by decreasing payouts to investors. These decisions will depend on a variety of factors for each company. As important as these considerations are, given the complete lack of data on which companies currently provide employee drug benefits, this paper does not attempt to further model the impact of pharmacare on business.
Likewise, we do not delve into the issue of how different provinces will be affected differently, or which level of government delivers the pharmacare program. We suspect there will be interest in equalizing these relative costs so that provinces are not short-changed for having more comprehensive existing programs.
Instead this paper assumes that provinces (and the federal government) will continue to spend on drugs that would be covered by the national formulary at similar rates to today, adjusted for population growth, demographic changes and price increases. Other program designs — e.g., more limited or more expansive formularies and weaker or stronger cost controls — would of course result in different costs and savings.
We have assumed that the federal government will directly pay for the additional net costs to the public sector of a national pharmacare program, i.e., the net public funds required in addition to existing baseline levels of federal and provincial support. That is because as a national initiative, federal funding may be required as an incentive, but also because the federal government is in a more sustainable long-term fiscal situation than the provinces are. Substantial infusions of federal capital would also act as a strong incentive for federal-provincial collaboration on a new pharmacare program.
Where might that financing come from? In our assessment, the federal government has three different policy options that could, on their own or in combination, fund pharmacare:
- Increasing specific taxes on employers and households or eliminating tax expenditures;
- Redirecting spending and revenues, or incurring new public debt, with no specific additional fees or taxes applied; and/or
- Applying patient user fees, co-payments and deductibles.
In our assessment, the first option is the most achievable and politically realistic. A national, single-payer pharmacare plan will save employers and households $16.6 billion in 2020, make Canadian businesses more competitive and free up billions of dollars that could be spent by households and employers in other areas.
A national pharmacare program would also result in improved population health and lower downstream public health care costs, such as those that result from people not taking medication as it is prescribed, usually for financial reasons. There is a good case, in other words, to go into deficit, if need be, to fund the new program. But politicians are generally wary of deficit spending, especially so close to an election, even with interest rates as low as they are today.
Unless the federal government can show it has the funds to pay for a comprehensive program, it may also come under pressure to delay pharmacare, implement a more limited national plan and/or require patient co-payments to help cover the costs. None of these options would achieve the health and social benefits of a comprehensive universal pharmacare program, nor would they achieve the same magnitude of savings.
In countries with national pharmacare where there are even modest co-payments, such as Germany and New Zealand, non-adherence rates are considerably higher, which creates avoidable costs to the health care system. Even small co-payments are a barrier to access and would reduce the benefits of a national pharmacare plan.
There are legislative barriers to co-payments and fees in Canada as well. The federal government does not allow provinces, hospitals, doctors or other health care providers to charge patients user fees or apply extra-billing to insured health services under the Canada Health Act. If a national pharmacare program were established in legislation under the Canada Health Act and included as an insured service, presumably extra billing and user fees would also not be allowed.
If a national universal pharmacare plan were established in legislation outside of the Canada Health Act, however, charging user fees would establish a worrying precedent. For these and other reasons, our analysis here does not consider options for paying for pharmacare that include co-payments except, as mentioned, for the $5 co-payment included in the PBO modelling for patients requesting a name brand drug when a generic version is available.
Part 2
PRESCRIPTION DRUG COSTS TO HOUSEHOLDS, EMPLOYERS AND GOVERNMENTS AT PRESENT
This section considers current household spending on prescription drugs, through out-of-pocket spending and private or workplace drug insurance plan premiums, and compares that spending to the expected savings from introducing a national pharmacare program.
Statistics Canada figures from the Survey of Household Spending (SHS) show that, in 2016, Canadian households spent an average of $455 annually, out of pocket, on prescribed medicines and pharmaceutical products.9 In addition to this direct spending on prescription drugs, households also indirectly spent $308 on private or workplace health plans that cover all or a portion of drug costs.
This means that Canadian households spent an average of about $763 annually on prescription drugs in 2016,10 an amount that still excludes the substantial expenditures of public drug plans for particular groups such as seniors (see Table 3), and for prescription medication delivered in hospitals.
As a share of total private health insurance costs, employers paid 60% and households 40% in 2016, although this applies to all services covered by insurance plans, including drugs, dental, vision, extended health benefits and others.12 If we separate the prescription drug costs portion, which amounts to 41% of private health insurance expenditures, employers indirectly contributed $458 per household to prescription drug expenditures via private drug insurance.13
In total, households and employers spent an average of $1,221 per household on prescription drugs in 2016 through direct out-of-pocket spending and the drug portion of private health care premiums. If we add that up across the country, we find that direct and indirect spending on prescription drugs by households and employers (through private health insurance premiums) was $18.4 billion in 2016 and is forecast to increase to $19.4 billion in 2017.14
It should also be recognized that these medical expenses and health care premiums benefit from federal and provincial medical tax credits for individuals and tax deductions for corporations. These tax subsidies are in effect government expenditures in addition to direct spending on prescription drugs through the range of existing public drug plans, prescription drugs provided by hospitals and health clinics, and the amounts spent on government workplace health care plans.
For example, the federal medical tax credit is projected to cost the government $1.76 billion in 2019 (with $1.16 billion going to prescription drug costs if we as sume a 41% share as above) and the refundable version will add an additional $170 million that year. Meanwhile, tax expenditures for extended health benefits are pro jected to cost the federal government $2.84 billion in 2019.15 Since most provinces base their personal taxes on the federal income tax base, they will also have increased income tax revenues after pharmacare is introduced, as the use of these tax credits and deductions is reduced.

Source Statistics Canada, CIHI and authors’ calculations.11
Spending on prescription drugs and private drug insurance premiums varies by household income level, region and by other household characteristics. Figure 1 illustrates projected average household spending on prescription drugs in 2020, either out of pocket or through workplace drug insurance premiums, in 10 household total income groups (deciles).
As we can see, the middle (sixth) income decile is projected to spend the most out-of-pocket on prescription drugs ($670 per household per year) whereas the lowest income decile is projected to spend the least ($310 per household per year). The poorest simply cannot afford to spend money on prescription drugs.
Higher income households do not have the highest out-of-pocket expenditures because those with higher incomes often have private insurance that covers prescription drugs. To add more context to these numbers, the poorest spend on average 1.7% of their income on out-of-pocket prescription drug costs while those in the top income decile, who are more likely to have private drug coverage, spend only 0.2% of income on the same.
In contrast to direct spending on prescription drugs, absolute spending on private drug insurance premiums rises significantly with household income level, from an average of $130 per year in the first decile to as high as $620 per year in the tenth. Low spending by the lowest income households is likely related to the lack of drug insurance available through their workplaces and the higher likelihood of being covered by public drug plans for seniors and people with low incomes. Still, these households are spending 0.7% of their lower incomes on drug plans despite public programs meant to counteract these costs while the richest households spend only 0.2%.
Figure 2 shows the amounts that households of different income groups would be expected to save on average in 2020 — because of lower spending on prescription drugs and health care premiums — if a national pharmacare program were introduced. These values include the impact of secondary tax and transfer effects, but without any changes to tax rates.
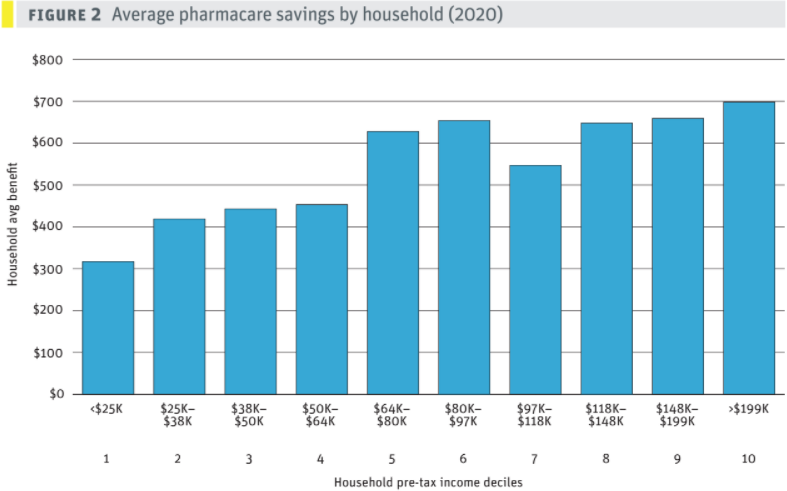
Source SPSD/M and author’s calculations.
As discussed above, pharmacare as modelled by the PBO does not cover all prescription medicines but reflects the Quebec formulary. The amounts saved by pharma care range from $320 for the lowest income decile — those with incomes below $24,664 — to an average of $700 annually for those in the highest income group.
As might be expected, savings are higher for larger households with elderly members and below average for smaller households. But on average, Canadian households would save $550 annually under a national pharmacare program.
It is notable how little average savings differ across different income groups, particularly in the fifth decile and above. Where there are differences, these may be the result of household size, age, public programs and affordability factors. But over all, the differences in average savings are not that large. This underlines the reality that the incidence of ill health, and therefore the need for prescription medicine, is experienced across all income groups and family types.
There is more variation in the amounts that different households currently spend on prescription drugs (that would be covered by a pharmacare program) as a share of their income. The poorest 10% of households would save on average 1.8% of their household income while those at the top would save less than 0.2% of their income. Prescription medicine is clearly not a luxury good but a necessity — and often a life and death necessity — that should be available to everyone just like public health care.
The amounts estimated through this analysis are lower than the total amounts currently spent on prescription drugs for two reasons. First, we used the PBO’s underlying approach, which models a national pharmacare plan using the list of drugs covered by the Quebec formulary. This “comprehensive” formulary does not cover all drugs; they must be considered effective or provide a therapeutic value. Even so, Quebec’s plan is the most extensive of all provinces, covering 8,000 drugs.
Second, the net savings by households are also lower because the SPSD/M analysis takes account of secondary tax and transfer impacts that counteract, to some degree, the savings from not paying for prescription drugs. With far less out-of-pocket spending on prescription drugs and lower spending on private health insurance premiums, households would not need to make use of federal and provincial tax credits in these areas.16 Tax deductions for private health care premiums are much more preferential for higher incomes, both because households in these deciles spend more on average on these premiums and because their tax rates are higher, so they benefit more from tax deductions.
Part 3
TAX AND REVENUE OPTIONS FOR PAYING FOR PHARMACARE
Having looked at the current costs of prescription drugs and the potential savings from pharmacare, we now consider seven different tax measures — five individual measures and two hybrid options combining two or more tax changes — the federal government could deploy to fund its part of a comprehensive and universal national pharmacare plan.
As mentioned, under our hybrid PBO model the government would need an additional $10.4 billion per year to introduce a national single-payer universal pharmacare program on top of existing federal and provincial spending on prescription drugs. The numbers below all assume the federal government takes on the $10.4 billion in additional costs of pharmacare and that the program is in place by 2020. The following five individual tax measures are considered:
- Increasing the federal Goods and Services Tax (GST) from 5% to 6.5%. This increase would generate an estimated $10.5 billion annually for the federal government.
- Increasing the general corporate income tax rate from 15% to 20.25%. This would also generate net federal revenues of $10.4 billion annually after accounting for secondary tax impacts.
- Increasing each personal income tax rate except the lowest rate by 1.8 percentage points. Under this scenario, the first tax bracket (for taxable income up to $48,600) would remain at 15%; the second bracket (for taxable income between $48,600 and $97,100) would increase from 20.5% to 22.3%; and all other tax rates for other brackets would also increase by 1.8 percentage points. These increases would generate an estimated $10.2 billion annually for the federal government.
- Introducing a flat 1.1% payroll tax. A 1.1% payroll tax split 50–50 between employees and employers, with a $10,000 initial exemption threshold and no upper threshold,17 would generate gross revenues of $10.6 billion. This amount would be reduced to a net gain of $10.3 billion after tax exemptions for this type of deduction are taken into account.
- Closing tax loopholes. Rather than raising taxes, the government could spend less on deductions and other loopholes that overwhelmingly benefit high income earners. Increasing the capital gains inclusion rate, for example, from 50% to 75% (where it was until 1999) for both personal and corporate income would increase the federal government’s revenues by an estimated net amount of $9.1 billion annually. Raising the inclusion rate would also generate $2.3 billion for the provinces given the way the rate affects the definition of taxable income. This option would therefore likely require more negotiation with provincial governments.
On top of these five individual tax options, the federal government could generate pharmacare funds using a combination of different taxes and revenue tools. For instance, France finances a share of its health care costs with taxes on tobacco and alcohol, on the pharmaceutical industry and on private insurance companies, while other countries use a variety of different dedicated taxes to help fund their health care systems.
To keep this analysis simple, we examine two options for combining tax measures that would generate the full additional funds required to implement a national pharmacare program:
- Raising approximately half the revenues from corporate taxes and the other half from personal income taxes. This involves increasing the general corporate tax rate by 2 percentage points (from 15% to 17%) and increasing each personal income tax rate except the bottom rate by 1.2 percentage points. Taxable income up to $46,600 would remain taxed at a rate of 15%, but for all other tax brackets the rate would increase by 1.2 percentage points (e.g., from 20.5% to 21.7% in the second tax bracket). These measures combined would increase federal revenues by a net total of about $10.5 billion annually.
- Increasing the GST, corporate income taxes and personal income taxes all by smaller amounts. Increasing the GST by 0.5 percentage points (from 5% to 5.5%), increasing the federal general corporate income tax rate by 1.8 percentage points (from 15% to 16.8%), and hiking each personal income tax bracket except the lowest by 0.6 percentage points would increase net federal revenues by $10.3 billion.
Using the SPSD/M we calculate the net annual impact of each of these measures on the finances of households of different income and family types, then for each decile incorporate the savings from lower spending on prescription drugs and health premiums. These calculations are summarized in Table 4, along with the net impact on major sectors of the economy (in millions of dollars) and on provincial and federal government revenues.
A positive figure indicates that the household, government or sector has, on average, a net financial gain from pharmacare (i.e., the savings from lower spending on prescription drugs and related health care premiums outweigh the slightly higher tax rate), while a negative figure indicates that the household or sector would pay more on average as a result of these changes. The additional revenues for the federal government would go toward the additional costs of a national pharmacare program, estimated in our scenario to be $10.4 billion annually.

Source: SPSD/M and authors’ calculations.
Note: Positive numbers indicate a sector being better off, negative numbers indicate where the sector is paying more net of all changes.
The table shows that in aggregate households and businesses combined would reduce their overall costs by $5.0 to $6.3 billion with the introduction of a universal national pharmacare program, even when we include the new revenue generating options. Provincial governments stand to gain in most scenarios as well. However, the impacts are very different by sector depending on what revenue tool is used.
Despite these differences, there is a net gain for Canadian households under all revenue generating options except two. Only in the GST and personal income tax scenarios is the household sector worse off and by less than $50 a year on average. Alternatively, paying for pharmacare with higher corporate income taxes makes households on average $550 a year better off.
In general, we can say that while employers and households benefit from pharmacare through lower costs, paying for it by taxing only one of these sectors skews the net benefit. It should also be emphasized that this is based on relatively cautious estimates of the aggregate savings that would be achieved with a national pharmacare program. More aggressive price controls over drugs would lower the revenues required to fund a pharmacare program, leading to higher net benefits across the spectrum of options.
Part 4
DISTRIBUTIONAL IMPACTS OF THE VARIOUS REVENUE OPTIONS
Now that we have a general sense of the financing options available for pharmacare and their average net impact on households, government revenues and business, we can zoom in on the distributional impacts of each option. This information may be of value to the federal government as it considers how best to implement a universal national pharmacare plan that benefits everyone.
For detailed calculations of these distributions, see Appendix F (Table 12). The figures in Table 4 are averages — to see a more complete distribution of savings by decile the reader should examine the charts in Appendix B.
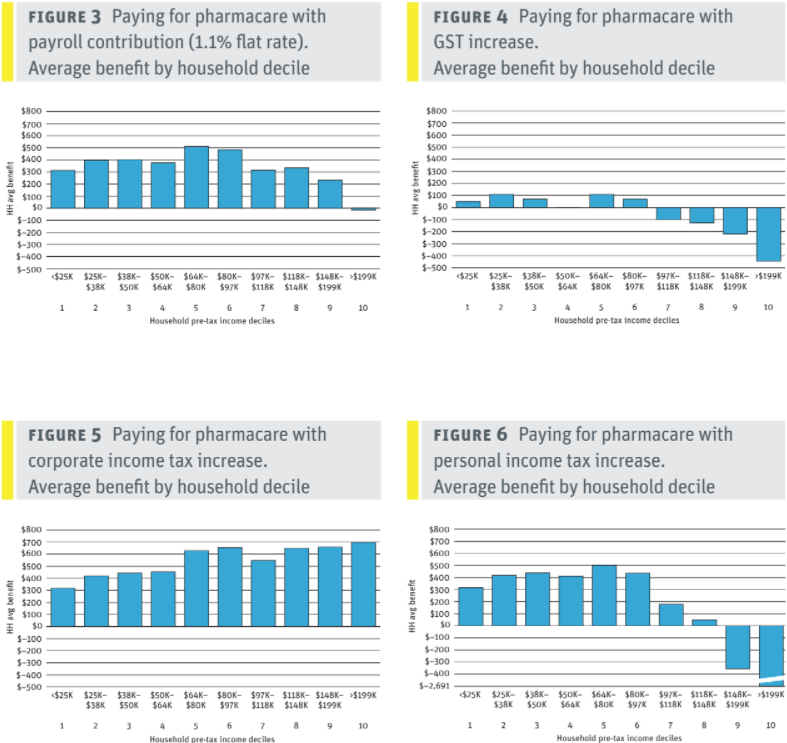
GST increase
Raising the GST by 1.5 percentage points (from its current 5% to 6.5%) would be the least equitable way to pay for a national pharmacare program. The GST is a relatively regressive tax compared to the other taxes examined here, and one that falls entirely on households. Even so, this least optimal revenue generating option still leaves households only slightly worse off in the aggregate after pharmacare is introduced, with an estimated average net loss per household of $50 in 2020.
Despite the regressivity of the GST, lower- and middle-income households would still see an average net benefit from pharmacare of up to $110 in 2020 due to the large savings from not having to pay up front for prescription drugs and private insurance coverage. However, those with incomes above $97,000 would pay on average more from the hike in the GST than they would directly benefit in financial terms from the introduction of a national pharmacare program. Net benefits by family type range from a net loss of $240 annually for 2+ adults with children to net gains of $70 and $160 for families with elderly adults.
While, on average, households would only lose a little under the GST hike scenario, our SPSD/M analysis estimates that in any one year there would be fewer net gainers (5.5 million) than households who would pay more each year (10.1 million). This may seem counterintuitive, but it is the natural result of any type of insurance that pools risk. Many households contribute smaller amounts into insurance programs through premiums or taxes so they are insured against much higher costs if they suffer accidents or become ill. Over several years, and especially as household family members age, the proportion of families that are net financial beneficiaries under pharmacare would likely increase.
The big beneficiaries from using an increase in the GST to pay for the additional costs of a national pharmacare plan would be employers, who would experience windfall savings estimated at $5.6 billion annually. This is because the GST is a value added tax that is borne entirely by consumers.18 With the introduction of a national pharmacare plan, workers could be able to negotiate with their employers to gain additional benefits or higher pay, but that would have to be done on a workplace by-workplace basis with no guarantees.
Provinces also see their revenues increase in the GST scenario — by just under $1 billion a year — as the money they will save on drug insurance premiums is converted into higher taxable income.
Corporate tax increase
In contrast to increasing the GST, raising the general federal corporate tax rate by 5.25 percentage points (from 15% to 20.25%) to pay for pharmacare would result in the greatest net benefits to households of all the options considered here.19
Overall, Canadian households would be better off in the corporate tax scenario by an estimated $8.6 billion annually — the result of reduced costs on prescription drugs and related private health insurance premiums. That net benefit works out to an average of $550 per household.
The estimated average net benefit per household varies from $320 for the lowest income group to $700 for households in the highest income group. While the absolute net benefits are larger for higher income households, as a share of household income benefits are highest (at 2%) for low income households, equal to almost a week’s salary. This is a considerable amount, especially for those on tight budgets. These calculations do not take into account the relief of not having to worry about the cost of prescription medicine, which is especially important for people earning lower incomes.
The distribution of net benefits by family type is also relatively equitable, ranging from $360 for single adults to $690 for couples living with an elderly adult.
Employers, on the other hand, would pay a net $3.5 billion more annually than they would save from national pharmacare. That figure is the result of subtracting the pharmacare savings to employers (an estimated total of $6.5 billion in 2020) from the sum of additional taxes that year (an estimated $8.9 billion) and the extra $1 billion employers would pay on higher taxable income as a result of saved drug insurance premiums.
However, the distribution of costs and benefits in this scenario would vary considerably among employers; those who currently provide private health care insurance would benefit while many profitable corporations would end up paying more. Unfortunately, there is no publicly available data on employer spending on benefits and profitability that is substantial enough to analyze these impacts in detail. Corporations might respond to this revenue-generating option by raising prices for consumer products and services, lowering investment, shrinking payrolls or reducing payouts to shareholders. We do not attempt to quantify these responses here, nor do we attempt to predict how increased funds in the pockets of Canadians will boost corporate profits.
Provinces would see their revenues increase by just under $1 billion if pharmacare is funded entirely through a corporate tax increase. This is because taxable income will increase for employers and employees as insurance premiums are reduced. If the increase in corporate tax rates seems significant, we should keep in mind it was 20.25% in 2008 and is currently 21% in the United States.
Personal income tax increases
Personal income tax brackets could be changed in various ways to generate the additional $10.4 billion to pay for a national pharmacare program. Here we examine a simple option that would be relatively progressive: increasing by a modest 1.8 percentage points the tax rates for all income brackets except the lowest.20 That would mean that for taxable income up to $48,600, the rate would remain at 15%, while for incomes between $48,600 and $97,100 it would increase from 20.5% to 22.3%. On brackets above that the rate would similarly go up by 1.8 percentage points.
These personal income tax increases would generate an estimated $10.3 billion annually for the federal government after accounting for some secondary tax impacts. This income tax option would be relatively progressive in terms of its impact on households, since higher income earners would pay more to fund a new program that benefits everyone. At the same time, all the additional costs of pharmacare would be borne, in this scenario, by households and none by employers. And overall, the average benefit to the household sector is slightly negative by half a billion dollars — an average of $30 per household — in 2020.
However, middle- and lower-income households would be significantly better off on average — netting benefits of about $300 to $500 per year for incomes below $100,000 — while households with incomes above $150,000 would pay considerably more on average. The top 10% of households by income (earning above $200,000) would pay an average of about $2,690 more in income taxes on top of the benefit they receive from reduced spending on prescription drugs and related health insurance premiums.
All in all, a majority of Canadian households would be net financial beneficiaries under this income tax scenario (8.2 million people) while about a third (5.3 million) would be financially worse off, in that they would pay more in additional taxes than they would receive in savings from pharmacare in 2020.
As with the GST tax increase option, employers would also be major beneficiaries from an income tax–based pharmacare solution, with windfall savings of about $5.6 billion (direct savings of $6.5 billion excluding secondary tax factors). Employees and workers may be able to negotiate increased benefits or higher pay to capture some of these gains, but this would have to be done on a workplace-by-workplace basis.
As in the previous scenarios, the provinces would see revenues increase by just under $1 billion as drug insurance premiums are converted into new taxable income.
Payroll tax of 1.1%
In this scenario a 1.1% payroll tax is evenly split between employees and employers at a rate of 0.55% each. Self-employed individuals would pay the full rate as they do for other social insurance programs. This would apply to all annual employment earnings above $10,000, with no upper limit, to generate $10.8 billion annually in new federal revenues. Net of secondary tax implications, a 1.1% payroll tax would raise $10.3 billion annually for the federal government.
As with the corporate income tax option, we do not attempt to determine how corporations will attempt to compensate for these new contributions. Though we must point out that, as substantially reduced corporate income taxes over the past several decades have not led to dramatically higher wages or investment, it is unclear why such a modest tax increase should lead to staff reductions or lower investment.
In fact, in this scenario employers, as a sector, would benefit by $1.0 billion net of all changes, as the $6.5 billion in savings from pharmacare more than offsets the new $5.3 billion contribution to the payroll tax. Households would experience a net overall gain estimated at $5.2 billion, consisting of $10.0 billion in lower spending on prescription drugs and related health premiums and another $600 million in secondary tax impacts, offset by $5.3 billion in direct additional costs to pay for the 0.55% payroll tax.
We estimate that households would experience an average net gain of about $340 a year, with all income groups except the top 10% benefiting on average between $230 and $510 in 2020. Households with incomes above $200,000 would pay a modest $15 extra on average more than they benefit from lower prescription drug costs under a national pharmacare program.
All household types examined would also be net beneficiaries on average, from $210 for single adults to $590 annually for households with two or more adults, one of whom is elderly. Across the board, 58% of households would be better off in 2020 while an estimated 33% would pay more in payroll taxes than they might benefit from lower costs, and 9% of households would be unaffected either way. However, these calculations are for 2020 only. We can expect the share of net beneficiary households to increase over a number of years, particularly as family members get older.
Provincial governments in this scenario see a slight loss in revenue as a result of exemptions from taxation on the payroll deductions offsetting the taxation of drug insurance premiums now converted to taxable income.
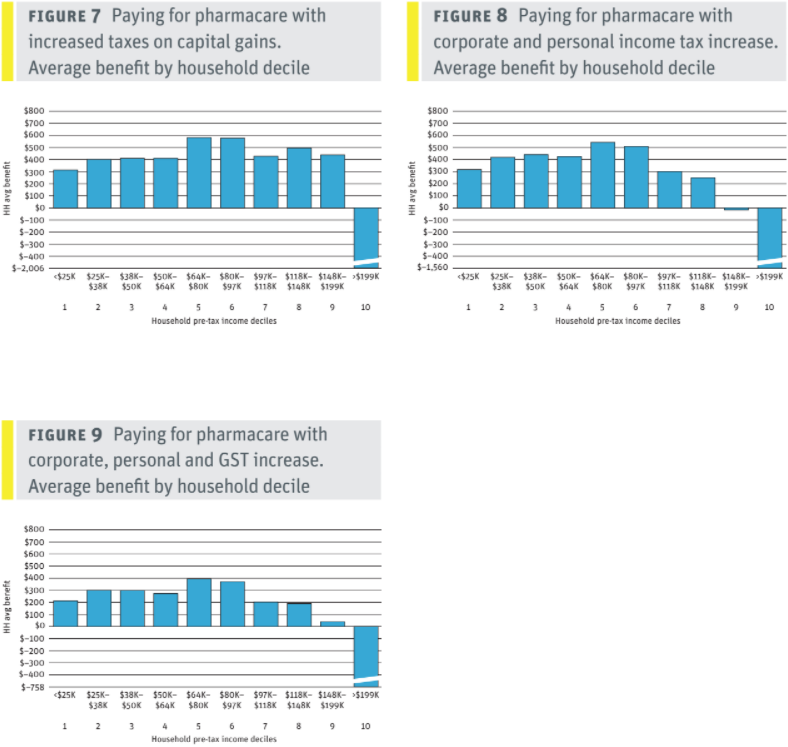
Limit tax loopholes
Rather than raise taxes, the federal government could choose to limit or close a number of different tax loopholes (otherwise known as tax expenditures) to generate the revenues to pay for pharmacare. We can make this point clearly by looking at just one tax expenditure: the taxation of capital gains.
Increasing the capital gains rate for both personal and corporate income from its current 50% to 75%, while maintaining existing exemptions for principal residences, small business, farmers and fishers, would raise a net $9.1 billion for the federal government to put toward national pharmacare.
Currently, individuals and corporations are only required to include 50% of the increased capital value of their investments in their taxable income. This means that corporations only pay a 7.5% federal rate of tax on these gains, while individuals in the top bracket pay a federal rate of 16.5% on capital gains — half the 33% federal tax rate that applies to employment income. The capital gains inclusion rate was rapidly reduced from 75% in 1999 to 50% in 2001, so increasing it to 75% would simply return it to its 1990s value.
Overall, employers would see a net gain of $1.7 billion in 2020 under this pharmacare financing scenario. The $6.5 billion they would save from lower private drug insurance premiums is far more than the $4.5 billion they would pay due to the increase in the inclusion rate. This saving would be slightly offset by an additional $0.3 billion in secondary tax impacts. Households would be better off in aggregate by $3.2 billion in 2020.
Provincial revenues would also get a jolt in this scenario in the magnitude of $2.4 billion a year. This windfall would make it more appealing for provincial governments to pick up the modest shortfall between the $9.1 billion the capital gains changes bring to the federal government and the $10.4 billion cost of our proposed national pharmacare program. The large provincial increase is due to the shared definition of taxable income between the provinces (except Quebec) and federal government.
For lower- and lower-middle income households, the benefits from this scenario are similar to those under the payroll tax option or by increasing corporate income taxes. Meanwhile, middle- and upper-middle income households would experience a net gain of $400 to $500 annually, roughly $200 more than with a payroll tax, although the corporate tax increase provides the best benefits for higher income households.
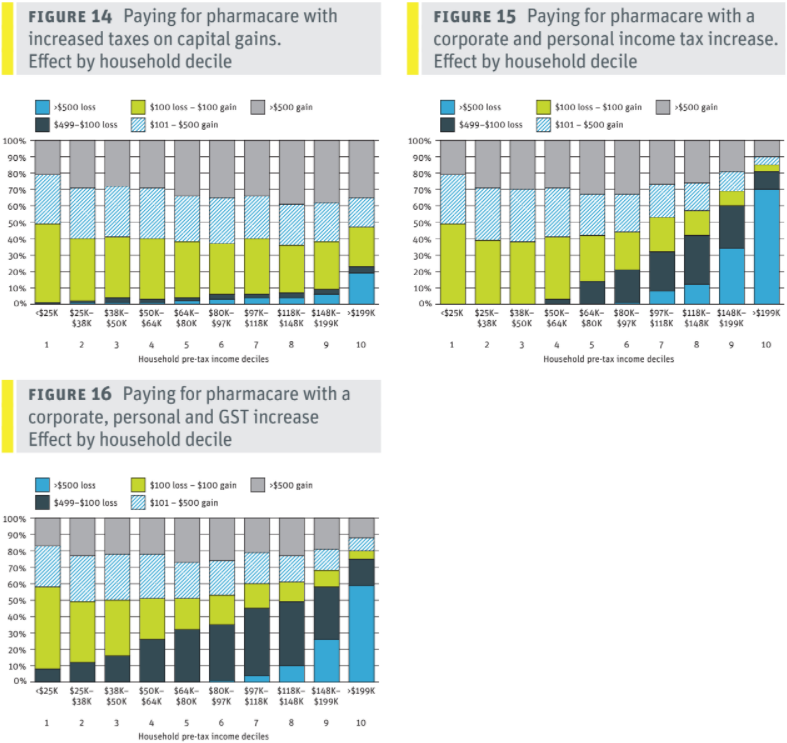
Those at the top of the income spectrum, with annual household incomes over $200,000, would pay substantially higher costs on average — an estimated $2,010 in 2020 — under the capital gains option. The impacts of increasing the capital gains inclusion rate would of course be concentrated among those with capital gains income. Yet this would affect just 9% of households, and only 6% of households in this group would be more than $100 worse off.
The average benefits of this option are highest for single-parent families and lowest for households with two or more adults, one of whom is elderly. For the other family types the average benefit is similar at between $230 and $280 in 2020.
This tax loophole option, along with increasing corporate taxes, can be considered one of the most progressive ways of paying for a national pharmacare program.
Increase corporate and personal income tax rates
Our analysis examined two different hybrid options for generating revenue to pay for a national pharmacare plan. In the first option the general federal corporate income tax rate is increased by 2 percentage points, from 15% to 17%, and the tax rates on all personal income brackets except the lowest are increased by 1.2 percentage points. These amounts were chosen to roughly split the benefits between employers and households.
This combination of tax increases would result in an estimated net increase in federal revenues of $10.6 billion annually after accounting for the secondary tax impacts of reduced use of the medical expense deduction and taxation of income returned due to drug insurance premium savings.
This first hybrid option would produce savings for employers of $2.1 billion a year, since drug insurance premiums would fall much more than corporate taxes would rise. In aggregate, Canadian households would be better off by an estimated net $2.8 billion annually, again as a result of their savings on prescription drug costs and related health premiums more than compensating for slightly higher personal income taxes.
Lower and lower-middle income households would experience net average benefits of $320 to $430 annually while middle-income households would experience a net average annual benefit of almost $600. Upper-middle income households would also experience annual net benefits of between $250 and $500 annually.
The top income decile, comprised of households with incomes over $200,000, would pay on average $1,560 more in tax through this option than they would gain from reduced spending on prescription drugs and related health premiums.
An estimated 57% of households would be net financial beneficiaries under this option in 2020 — a percentage we expect to increase over a longer time frame — while an estimated 25% of households would be down by $100 or more annually. The vast majority of households with incomes below $65,000 would either be better off or no worse off under this option.
Provinces in this scenario see their revenues increase by just under $1 billion since they would be able to tax employers and employees more as savings on drug insurance premiums are converted into taxable income.
Increase the GST rate, corporate taxes and personal income taxes
The final option we consider involves a 0.5 percentage point increase in the GST (from 5% to 5.5%), a 1.8 percentage point increase in the corporate income tax rate (from 15% to 16.8%) and a 0.6 percentage point increase to all personal income tax brackets except the lowest. As in the first hybrid option, the goal here is to roughly split the savings between employers and households.
In this hybrid scenario federal revenues grow by a net $10.4 billion annually after accounting for secondary tax factors. Employers and businesses would be better off by an estimated $2.5 billion annually, with their $6.5 billion in annual savings exceeding the $3.1 billion extra they would pay in higher corporate taxes and the estimated $800 million they would forgo in tax credits and benefits. In the aggregate, households would see savings of $2.6 billion in 2020.
All household income groups except the top 10% would be better off in this scenario by an average of $200 to $400 annually. Households in the second highest income bracket, with annual incomes between $150,000 and $200,000, would experience a net average benefit of $40 in 2020. Households in the top income decile, with annual incomes over $200,000, would pay an average of $760 more in taxes than they would benefit from lower costs for prescription drugs and related insurance premiums.
The net benefits are more variable by family type. Families with two or more adults and children would be better off by an average of just $30 annually while single parents would be better off by an average of $200 a year. Households with seniors would be better off by $300 in 2020.
Provinces in this scenario see their revenues increase by just under $1 billion, again due to the conversion of health premium savings into taxable income. While this option spreads the benefits evenly between corporate and household sectors, it is the second least favourable for most households among the scenarios considered in this report.
CONCLUSIONS
Canada’s federal and provincial governments have an historic opportunity to introduce a universal, single-payer national pharmacare plan. Not only could this significantly improve the health outcomes of Canadians by eliminating the financial barriers to filling prescriptions for those who cannot afford them, but it could also save Canadians billions of dollars annually.
Though a national pharmacare program would save an estimated $4–$10 billion annually in the aggregate, it would also involve a significant spending shift. Households and employers would achieve an estimated $16.6 billion annually in savings on out-of-pocket and insurance-based prescription drug costs while the federal government would be required to find an additional $10.4 billion to pay for the pharmacare program, resulting in overall economy-wide savings of $6.1 billion in 2020.
Despite these significant savings, part of which would be shared with the provinces, the increased federal government costs of such a program could very well be considered a major barrier. A range of policy options have been proposed to finance a universal single-payer pharmacare program should the federal government decide that additional fiscal capacity is required. Our analysis has examined the distributional impacts of these various options on different sectors, income groups and family types.
In our assessment, paying for pharmacare by increasing the corporate tax rate would provide the highest net benefits for households — in the range of $550 per household in 2020 — while increasing the GST would be the least progressive and result in an average loss of $50 per household in 2020.
Revenue generating options that share the costs of pharmacare between employers and households — through payroll taxes, increasing the capital gains tax rate, or using a combination of corporate and personal income taxes — would result in net financial gains averaging $160 to $330 per household in 2020.
While some options are demonstrably more progressive and fairer than others, even the least progressive scenario examined here — increasing the GST — would mean that households are only slightly worse off on average, with their savings from lower spending on prescription drugs and related health insurance premiums being roughly equivalent to the additional costs of the tax.
Other revenue options that involve increases to corporate, personal and payroll taxes, and/or closing tax loopholes, would be more progressive and result in significantly larger net benefits for a majority of Canadian households — in the range of $330 to $550 annually — while also increasing access to medicine and improving health outcomes.
The opportunity to expand Canada’s health care system to include a universal national pharmacare program is too important and beneficial for the federal government to pass up. It can also produce significant savings for households and businesses, as we have demonstrated in this report.
There is no need to develop a diluted, or fill-in-the gaps model that could not achieve the same beneficial health outcomes or degree of savings as a truly universal program. It is crucial that the federal government follow the advice of numerous experts by introducing a comprehensive public pharmacare program.
The federal government should also ensure that a national pharmacare plan is paid for in a progressive way that reduces inequalities and significantly improves the well-being of a majority of Canadian households. Our analysis shows the federal government has a range of different revenue generating options that would make this possible. What we need now is the political commitment to move forward and turn this historical opportunity into reality.
======
APPENDIX A: AVERAGE NET BENEFIT BY INCOME GROUP OF DIFFERENT REVENUE OPTIONS
APPENDIX B: GAIN OR LOSS BY HOUSEHOLD INCOME DECILE
The following graphs examine the proportion of households in each income decile that are better or worse off due to pharmacare and how it is paid for. The graphs are grouped into broad categories to provide more detail than a straight average. Better or worse off is defined as the cost of any new taxes after the savings from reduced out-of-pocket drug costs and reduced insurance premiums due to pharmacare. These calculations are for 2020 alone.
Importantly the gain and loss calculation ignores the insurance benefit of pharmacare (e.g., Canadians are insured against substantial drug costs due to unforeseen illnesses). The insurance value of pharmacare may well be higher than the losses families experience in 2020 in straight financial terms. As with any insurance, small premiums are paid annually to avoid substantial surprise costs at a later date. In most cases, those experiencing a loss in 2020 are those who didn’t get very sick and didn’t need prescription drugs that year.


APPENDIX C: METHODOLOGY
This report makes extensive use of Statistics Canada’s Social Policy Simulation Database and Model (SPSD/M) 26.0 with substantial changes described in Appendix G. SPSD/M provides a complete computation model of the Canadian tax and transfer system at both the federal and provincial levels. It also includes calculations of impacts on sales tax revenues. Computations are based on an aggregation of several Statistics Canada surveys meant to produce results that should accurately predict the impact of tax/transfer changes.
All projections in this report are for 2020 unless otherwise stated.
The construction of the payroll contribution scenario involved extensive changes to SPSD/M and assumed that all contributions will reduce taxable income, similar to the treatment of enhanced Canada Pension Plan contributions. These secondary tax implications are included on both the household and the employer sides. All other scenarios for raising revenues alter pre-existing SPSD/M parameters.
The calculation of household expenditures on out-of-pocket prescription pharmaceuticals and their expenditures on private drug insurance, as separate from private health insurance more generally, produced several challenges. As part of its sales tax calculations, SPSD/M contains household expenditures drawn from the Survey of Household Spending. Two categories contain portions of the spending items of interest (their decomposition is examined in Appendix E).
Contributions to private health insurance are tax deductible. As such, if pharmacare results in savings in this area, it will result in reduced tax deduction, which is accounted for in the simulations above through changes to SPSD/M. In practical terms, the employee portion of contributions to private health insurance plans would be paid to employees. This assumption may be debatable. Instead of employers paying the reduction in health insurance premiums back to workers, employers may keep those savings for themselves. Alternatively, employers and employees may choose to re-invest the savings from pharmacare into better health coverage in other areas. Each of these outcomes would have different tax impacts than what’s otherwise assumed in this report.
Unfortunately, no Canadian sources provide micro-data on how much different employers and businesses spend on prescription drug insurance or medical insur ance more generally. While private firms do file T2 corporate income tax forms and line 8621 of the General Index of Financial Information (GIFI) exists to specify group insurance benefits for employees, there is no requirement that it be filled out in that level of detail, nor is there any financial incentive to do so. Health benefits may sim ply be included in a higher level of aggregation in the same form. Even if this data was faithfully recorded, no anonymized micro data file of corporate tax returns is publicly released by Statistics Canada. This is in stark contrast to household tax filings which form the basis for several micro-data files that are publicly available. Consequently, we aren’t able to provide detailed analysis on how different revenue options would affect different employers outside of aggregate estimates.

As far as we know, the relationship between profit and private health benefits is unknown. For example, if drug insurance premiums are decreased by $1 billion, how much of that decrease will be experienced by employers presently declaring a profit. Certainly a large portion of employers with private drug insurance are actually public sector employees either in the public service or publicly funded fields such as education or medicine. Among private sector employers, only a portion will declare a profit and those may not be the ones paying for private drug insurance. As such, we assume, very roughly, that 50% of any drug insurance premium savings will be at employers declaring a profit. This forms the foundation for the estimation of secondary corporate tax impacts.
Employer savings from pharmacare are confined to savings from their contribution to private drug plans. This amount is calculated based on the amount that households save and the fact that households paid 40% of private health premiums in 2016.21 The proportion that households pay of private health insurance premiums has risen rapidly since 2010 when it sat at 26%. This report assumes that value remains constant at 40% in 2020.
As private drug insurance premiums are converted back into income, secondary tax implications apply, namely that those contributions no longer generate a tax deduction. This has implications for both federal and provincial income tax revenues. In order to estimate this impact in each scenario, a federal effective tax rate of 7.9% is calculated for increased corporate income due to drug premium savings as detailed in Table 5. That 7.9% rate is less than the federal statutory corporate income tax rate, as it includes employers who do not declare profits either because they are public sector employers or because their business isn’t profitable. This rate is then used to determine the secondary federal tax implications.
We assume that the secondary provincial tax implications for employers are similar, just at a proportionally lower rate, and that 60% of all corporate income taxes flow to the federal government with 40% flowing to the provinces.22 This ratio is maintained to estimate the provincial secondary impacts. The secondary effects are only applied to the net change in taxable income in cases where the scenario has an impact on corporate taxable income. For instance, in the payroll tax scenario, employers save $6.5 billion from private drug insurance, but pay out $5.3 billion in the new payroll tax. The net change is thus a savings of only $1.2 billion, upon which the 7.9% is applied to calculate the secondary federal implications.
In the scenarios in which corporate income rates are also changing, the 7.9% effective rate is further scaled to the increase. For example, in the CIT scenario, employers save $6.5 in drug premiums, which is evaluated at the 7.9% effective rate. However, that additional taxable income is now also evaluated at the higher 20.25% rate, an increase of 5.25%. In this case the 7.9% is increased in the same proportion as 5.25% is to the federal statutory rate of 15%, that is, 0.35 (5.25/15). The effective tax rate on the employer $6.5 in savings including the CIT rate increase is 7.9% + (7.9% x 0.35).
The provinces receive 40% of corporate income taxes and the federal government receives 60%.23 As with households, we assume that any savings in drug insurance premiums will increase taxable income and that 60% of any increase in corporate income tax revenues will flow to the federal government and 40% to provincial governments.
APPENDIX D: RECONCILIATION OF DATA FROM THE PARLIAMENTARY BUDGET OFFICER AND STATISTICS CANADA / CANADIAN INSTITUTE FOR HEALTH INFORMATION
This report is based on the conclusions of the PBO on the cost of a federally funded pharmacare program. However, those conclusions were reached using the Quantiles IMS tool, which provides microdata on the types of prescriptions filled, their cost and who paid for them between the patient, a private insurer or a government program. This data is collected from the perspective of the pharmacists filling the prescriptions. Based on this dataset, the PBO calculated that in 2015–16, Canadians spent $4.7 billion out of pocket to fill prescriptions, private insurance paid for another $10.7 billion, and government programs, like pharmacare for seniors and families on social assistance, paid an additional $13.1 billion.
Another dataset created by the government-funded Canadian Institute for Health Information shows slightly different expenditures for calendar year 2016 (Table 6). Important differences exist between these datasets. The basis for the out-of-pocket expenditures from CIHI is the Statistics Canada Survey of Household Spending (SHS). The SHS is also the basis for expenditures in SPSD/M, the tool used to estimate net benefits in this report. While the PBO dataset records spending from the pharmacist’s perspective, the SHS records it from the patient’s point of view. While these two sides of the same transactions should theoretically be the same, Table 6 shows a substantial variance between them.
The PBO dataset allocates transactions between the three sources in Table 6 based on the majority payer if there are two. For instance, if a prescription is paid for entirely by private insurance except for a $10 co-payment by the patient, the out-of-pocket category is allocated $0 while the private insurance category is allocated the entire cost of the prescription, including the $10 paid by the patient. The PBO dataset also allocates expenditures based on their distribution at the time of purchase. For instance, if a patient paid for a prescription but was later completely reimbursed, that expenditure will still fall in the out-of-pocket category. While these methodological wrinkles would shift expenditures between categories, they should not affect the total expenditure across all three categories.
While the private insurance and paid-by-governments totals are almost identical between the PBO and CIHI, the out-of-pocket line is substantially lower in the PBO dataset. This suggests that the variance in Table 6 is not due to categorization but rather because it is from another source. A likelier reason is that the SHS is capturing out-of-pocket fees that aren’t being captured from the other side of the transaction in the PBO dataset for some reason.

Source Parliamentary Budget Office,24 Canadian Institute of Health Information.25

This report adjusts the PBO estimates upward to reflect the slightly higher expenditures from both private insurance and governments reported by CIHI. Within these constraints, key ratios are maintained, in particular the rate of growth in expenditures between 2016 and 2020 and the savings due to their modelling of pharmacare. The reconciliation between these two datasets is shown in Table 7.
APPENDIX E: METHODOLOGY FOR PRESCRIPTION DRUG COST IMPUTATION
While SPSD/M contains microdata on expenditures, the expenditure categories are aggregated compared to how they are collected in the SHS and how they have been published in the most recent SHS Public Use Microdata File (PUMF) from 2009. As such, estimation of the more specific categories of both private health premiums and out-of-pocket prescription costs were necessary using the 2009 PUMF, the last time microdata of these categories became publicly available. Those estimates were based on broader categories contained within SPSD/M, specifically from the fxio12 and fxio26 categories and their associated variables. Given the SHS microdata in 2009, it is possible to test approaches to estimating the expenditure of interest from the broader category.
The SPSD/M fxio12 category, “Pharmaceuticals and Therapeutic products,” contains prescription medicines (the expenditure of interest for this report); however, it also contains health care supplies, other medicines and pharmaceutical products, eye-care goods and services and other medical services. The fxio26 variable contains private health insurance (the category of interest for this report), but it also contains homeowners’ insurance premiums and vehicle insurance premiums (except in Saskatchewan, Manitoba and British Columbia).
The key to isolating the spending of interest from the broader SPSD/M categories is the ratio between the larger category and the smaller category of interest. Several regressions and transformations were used to estimate the ratio using characteristics of the household such as number of seniors, province, household income, the number of children, etc. However, in no cases were these approaches notably better than random assignment when it came to determining the ratio. This is likely for two reasons: there is no variance in the ratio in many cases, and existing insurance invalidates obvious correlations. In a third to half of households the ratio of the broader category to the smaller one is zero. Which is to say that the family spends money on the broader category, say insurance generally, but spends nothing on private insurance. Having so little variance makes correlations much more difficult.
Other obvious cases, like seniors needing more prescription medicine, are not useful in estimating household costs and ratios, as private and public insurance often cover these costs. For example, a senior might need substantial prescription medicines, but their out-of-pocket costs may be very low, even zero, as these costs are often covered by public plans. This means that their ratio of health care spending to out-of-pocket drug spending could also be zero even if they require many prescriptions, further confounding estimation of the ratio based on socio-demographic factors.
This report thus randomly assigns ratios to households for variables fxio12 (healthcare costs to out-of-pocket drug costs) and fxio26 (private insurance to private health insurance) as detailed in Table 8 and Table 9. These probabilities and target mean ratios match the values from the 2009 PUMF, although adjusted slightly to match changing ratios between 2009 and the most recent data available from Statistics Canada Table 11-10-0222-01.
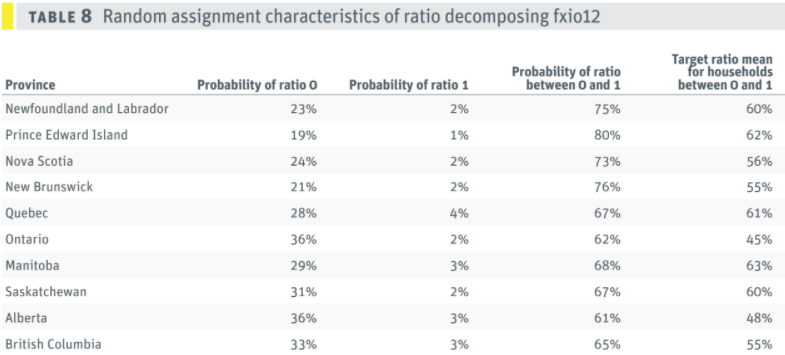

To gain a ratio for either category there must be a non-zero expenditure to begin with. Then each household has a set probability of having a state assigned to it based on the province. There are three possible states: being assigned a ratio of zero, a ratio of one, or a ratio of between zero and one. If a household is in the third state then the actual ratio between zero and one is itself random, but it will sit along a normal curve whose mean is also set by the data. In the case of a household in Newfoundland and Labrador and a positive expenditure in the fxio12 category, the household has a 23% chance of getting a ratio of zero, a 2% change of getting a ratio of 1 and a 75% chance of getting a ratio between zero and one. If a family ends up in the most likely category of getting a ratio between zero and one, it will then receive a random ratio that if calculated across all households in Newfoundland and Labrador in this last state, would have a mean ratio of 60%.
In order to move from private health insurance to just the portion of that insurance devoted to drugs that would be impacted by national pharmacare, a common ratio of 0.41 is used based on CIHI NHEX table H.3 (2015 value) of the proportion of private health insurance spent on prescription drugs in Canada. Unfortunately, there is no more precise way to determine if for instance health insurance premiums paid by high income households have a lower proportion of their premiums devoted to drugs than lower income households. In this report, it is assumed to be constant across all households.
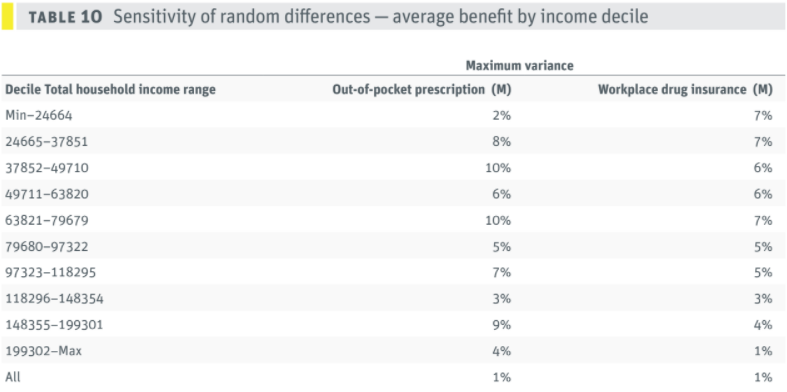
As a sensitivity analysis on the stability of this approach, four separate estimates were conducted for out-of-pocket prescription drug costs and workplace drug insurance premiums. Each estimate re-seeds the random number sequence such that a household that previously received a ratio of 0 for the fxio12 could now receive a ratio of 1. The stability is examined for total amounts by household income deciles in Table 10 and counts of households in various categories of benefit by household income deciles in Table 11. Each cell presents the maximum variance among the four estimates with different random seeds.

The sensitivity to randomization differences remains small in the calculation of out-of-pocket expenditures and expenditures on workplace drug insurance. In all cases, the maximum error remains at or below 10%, which is to say that across these four runs, when households are randomly reassigned a ratio using the rules above, the expenditures by household income decile change at most 10%.
The error for the counts of families by expenditure level in Table 11 is higher. In part this is due to more categories. Larger errors occur in the lower- and middle-income deciles and appear to the smaller at higher income levels and larger expenditure levels. Across Table 11 the largest error is 16% for the fourth income decile in the count of households who spend between $2 and $100 on prescription drugs.
APPENDIX F: DETAILED ACCOUNTING OF SCENARIOS BY SECTOR
Table 12 provides additional information on the summarized sectoral breakdown in Table 4 above. The out-of-pocket and private drug insurance columns represent the savings expected for both households and employers from the introduction of a universal national pharmacare program. The “new tax (federal)” column calculates the direct federal returns from the scenario in question. For instance, the 1.5% increase in the GST is expected to raise $9.3 billion for the federal government. The “secondary tax implications (fed)” column represents all other tax and transfer impacts at the federal level, over and above to the “new tax (federal)” column. This column will include increased taxes due to lower medical expense deduction claims as a result of lower expenditures on prescription drugs. It will also include higher taxes due to higher taxable income of both households and profitable private sector employers due to lower drug insurance premiums being converted to taxable income. In other words, this column represents the government savings as a result of lower tax expenditures or tax loopholes supporting prescription drugs through the tax system. The “secondary tax implication (prov)” column conducts similar calculations as its federal counterpart, but with the implications for provincial taxes. The “net change” is the aggregate result for that sector across all previous columns. For more details on the secondary tax implications for employers see Appendix C.

Source: SPSD/M and author’s calculations.
APPENDIX G: SPSD/M MODIFICATIONS
While much of the scenario testing above was possible using pre-existing SPSD/M parameters, several changes were necessary to implement both the savings from pharmacare, the imputation of drug costs and the payroll tax options. Detailed SPSD/M code changes are available upon request to the authors.
The following is a list of the modules changed in “glass box” and the reason for those changes.
Vsdu.cpp, vsu.h, mpd.cpp, mpu.h : These modules were changed to incorporate new user-defined variables and parameters necessary to support the other changes.
Txitax.cpp : The claim for the medical expense deduction in its refundable and non-refundable versions was reduced one-for-one for every dollar saved in out-of-pocket expenditures due to pharmacare until the claim was reduced to zero.
Txcalc.cpp, Txqinet.cpp : These were changed to eliminate deductions when any savings in drug insurance premiums were realized.
Txinet.cpp : The imputation of out-of-pocket drug expenditures and private drug insurance occurs in this module using the rules outlined in Appendix E. Savings in these two groups are initially at the household level. They are allocated to individuals for tax purposes based on income. The calculations of the payroll tax premiums are included here as well.
Txinet.cpp, Txcalc.cpp, Gis.cpp, Memo1.cpp, Txqinet.cpp : Small changes were required across multiple modules to treat new payroll tax premiums similarly to the contributions to the enhanced CPP in that they reduce taxable income and impact GIS.
NOTES
[1] Office of the Parliamentary Budget Officer, 2017. Federal Cost of a National Pharmacare Program.
[2] Meaghan Campbell, “Justin Trudeau was a hard act to follow, but the next speaker defined the most important issue of the 2019 election,” Maclean’s magazine, April 22, 2018.
[3] Institute of Fiscal Studies and Democracy, 2019. National Pharmacare in Canada, Choosing a Path Forward, p. 53.
[4] Parliamentary Budget Officer, 2017. Federal cost of a national pharmacare program. Ottawa; Gagnon, Marc-André, 2014. A Roadmap to a Rational Pharmacare Policy in Canada. Ottawa, Canadian Federation of Nurses Unions; Morgan, S. G., J. R. Daw, et al., 2013. Rethinking Pharmacare in Canada. C.D. Howe Institute Commentary; Morgan, S. G., M. Law, et al., 2015, “Estimated cost of universal public coverage of prescription drugs in Canada.” Canadian Medical Association Journal, 187(7), pp. 491–497; Morgan, S. G., W. Li, et al., 2017, “Estimated effects of adding universal public coverage of an essential medicines list to existing public drug plans in Canada,” CMAJ, 189(8), pp. E295–E302.
[5] Public Health Agency of Canada, 2018. Key Health Inequalities in Canada: A National Portrait, 2018.
[6] Kate Pickett and Richard Wilkinson, 2009. The Spirit Level: Why More Equal Societies Almost Always Do Better, London, Allen Lane.
[7] House of Commons Standing Committee on Health, 2018. Pharmacare Now: Prescription Medicine Coverage for All Canadians, pp. 26–27.
[8] Office of the Parliamentary Budget Officer, 2017. Federal Cost of a National Pharmacare Program.
[9] Statistics Canada Survey of Household Spending, Table: 11-10-0222-01 (formerly CANSIM 203-0021). This figure varied from $408 to $471 in the five years from 2012 to 2016, with $455 remaining close to the average.
[10] Statistics Canada’s Table: 11-10-0222-01 reports “Private health insurance plan premiums” as $750 per household in 2016. This is inclusive of the $549 per household from “Private health care plan premiums.” The Canadian Institute of Health Information (CIHI) National Health Expenditures (NHEX) Table H3 reports private sector health insurance expenditures on prescription drugs at $11,074 million (2015) with total private insurance expenditures in 2015 at $27,094 million for a prescription drug to total expenditure ratio of 41%. Applying this ratio to the total average household expenditure on private health insurance we arrive at $308 per household (750 x 41% = 308) assuming no profit in the insurance industry from health insurance premiums.
[11] Ibid.
[12] The Canadian Institute of Health Information (CIHI) National Health Expenditures (NHEX) Table H3 reports total private insurance expenditures in 2015 at $27,094 million. Households in 2015 spent $750 each on average on “Private health care plan premiums” with 14.82 million households from Statistics Canada Table 36-10-0101-01 this amounts to total household expenditures of $10.64 billion in 2015, resulting in a ratio of 39% for households expenditures on private insurance to total expenditures assuming no profit from insurance companies. Reciprocally, 61% of private insurance is funded by employers. Projecting the 2015 CIHI total private health insurance premium to 2016 at a rate of 4% (the average over the previous four years) results in a slightly lower employer ratio of 59.8%.
[13] See footnote 13 for the calculations of the 41% figure.
[14] Canadian Institute of Health Information (CIHI), National Health Expenditures (NHEX), Table G.14.1, “Total private-sector prescribed drugs.”
[15] Finance Canada, 2018. Report on Federal Tax Expenditures - Concepts, Estimates and Evaluations.
[16] Transfers to households by governments would also decline by an estimated $109 million; as taxable income rises due to less being spent on prescription drugs and drug insurance, transfers are clawed back. The Canada Child benefit is the largest single contributor, with households losing $51 million worth in 2020.
[17] There is no maximum as there is with the yearly maximum pensionable earnings (YMPE) for the Canada Pension Plan.
[18] Some of the cost of the GST is borne by employers who are not GST registrants or are exempt, but this is relatively minor compared to the share borne by households. We were not able to adjust for this at a detailed level because of the dearth of other information on employer spending, but it has been indirectly accounted for through our calculation of secondary tax impacts.
[19] The option we considered involves no change to the federal small business tax rate, i.e., keeping it at the 9% rate that will be effective January 1, 2019. However, the federal government could alternatively in crease both the general and the small business tax rates by three percentage points each, i.e., to 18% for the general rate and to 12% for the federal small business rate, to generate a similar level of revenues (PBO Ready Reckoner). This would not otherwise affect the results of this analysis because we were not able to undertake any detailed modelling of the business sector.
[20] Raising the income tax rate on the top bracket alone would not raise enough revenue. The top federal income bracket generates an estimated $430 million per percentage point, so it would take an increase in the federal top income tax rate from 33% to 57% to raise $10.4 billion without accounting for behavioural responses. See Office of the Parliamentary Budget Officer, Ready Reckoner.
[21] Author’s calculations based on Statistics Canada’s tables 11-10-0222-01, 36-10-0101-01 and CIHI NHEX table H.3.
[22] Statistics Canada’s Table 36-10-0450-01.
[23] from Statistics Canada’s Table 36-10-0450-01.
[24] Parliamentary Budget Officer, 2017. Federal cost of a national pharmacare program. Ottawa, Table 3-1.
[25] CIHI, National Health Expenditure Trends, Table g.14.1.
======
ABOUT THE AUTHORS
David Macdonald is a senior economist with the Canadian Centre for Policy Alternatives.
Toby Sanger is the Executive Director of Canadians for Tax Fairness.
The authors would like to thank the following reviewers for their helpful comments on an earlier version of the paper: Marc-André Gagnon, Chris Roberts, Steven Morgan, Amanda Vyce and Michael Wolfson. They would also like to thank Rosa Zetler for her invaluable research assistance in the preparation of this paper.
