Résumé
For-profit long-term care facilities in Ontario and other provinces recorded far more COVID-19 infections and deaths of vulnerable residents than either municipal or not-for-profit facilities during the pandemic. We estimate that if for-profit facilities had the same lower death rate as municipal facilities, over 1,400 fewer residents would have died in 2020.
While failing to provide the level of care of their non-profit counterparts, for-profit long-term care (LTC) facilities in Ontario diverted billions in public funding into profits while paying very little in tax. We estimate that for-profit long-term care corporations diverted almost $4 billion in public funding away from improving care for residents to their profits over the last decade, and more than $400 million annually in recent years.
About one-third of core public funding for LTC is “unrestricted”, which means it can be spent however a facility chooses and any unspent money does not have to be returned to the government. This is the money that for-profit owners can claim as profit. We estimate that more than half of this money —$440 million in 2019— was diverted to profits.
If the funds that were diverted into profits had been spent to improve care, much death and suffering during the pandemic could have been prevented. Prioritizing the pursuit of profit over provision of high-quality care is a fundamental reason why housing conditions, levels of care, infections, and death rates have been worse on average at for-profit facilities.
The government of Ontario provides almost $6 billion annually in public funding to LTC operators, with a majority going to for-profit operators and about half of the for-profit total going to the four largest operators: Revera, Extendicare, Sienna, and Chartwell. These amounts are set to increase substantially and must ultimately be paid for by Ontarians through their taxes.
The corporations that reap profits from this public funding contribute very little back to the public purse. Three of the largest for-profit LTC operators in Ontario—Chartwell, Extendicare and Sienna—had an average effective tax rate of only 4.5% on their profit over the last decade. This is well below the Canada-wide average effective tax rate, which is already at historic lows. At the average rate, the three companies would have paid almost $500 million more in corporate income taxes between 2010 and 2019. One of the three—Chartwell—is able to pay little or no tax because it benefits from the controversial income tax exemption for real estate investment trusts, better known as REITs.
We only know about the tax avoidance of Chartwell, Extendicare and Sienna because they are publicly-listed and have to disclose some financial information. Privately-held for-profit LTC corporations have likely also taken steps to avoid taxes. Unfortunately, because of a lack of financial transparency, we cannot know how much tax they actually paid. Revera, the largest privately-held operator, has established subsidiaries in well-known tax havens.
Ontarians deserve the best possible long-term care. That requires thoughtful and effective spending of their healthcare dollars, transparency about where the money they provide to LTC goes, and for any corporations involved in that care to pay their fair share of the taxes on which they depend.
Summary Recommendations
Improving the long-term care that we provide to our elderly and vulnerable citizens is a key issue in Ontario. Poorer conditions in for-profit LTC facilities have been a long-term problem that were tragically magnified by the COVID-19 pandemic. The billions in public funding Ontarians provide for LTC should not be diverted to corporate profits. The findings of this report support three recommendations for Ontario.
Recommendation 1: Require all for-profit LTC operators to publicly disclose relevant financial, ownership, and employment information, including revenues, profits, taxes paid, executive salaries, and dividends. Facility level information on the use of public funds and staffing should also be disclosed.
Recommendation 2: Close loopholes that allow corporations receiving public funding to engage in aggressive tax avoidance schemes—such as the use of subsidiaries in tax havens, or the REIT structure—that provide tax breaks with no public benefit. Pending this closure, require for-profit operators to sign an agreement not to engage in aggressive tax avoidance.
Recommendation 3: Create a plan to shift all publicly funded long-term care facilities to nonprofit operators.
Rapport
Table of contents
- Introduction
- Table: Deaths from covid-19 by ownership type, 2020
- Billions in public funding going to corporate profits instead of care
- Public funding of long-term care
- Table: LOC funding envelopes and actual transfers, 2019
- Table: LTC facilities and beds by ownership type, 2019
- Table: Provincial public funding by envelope for different types of long-term care facilities 2018-19
- Profits diverted from Ontario LTC
- Table: Public funding for LTC diverted to corporate profits, 2010-19
- Profits in long-term care
- Analysis of publicly traded for-profit LTC companies
- Table: Who got the money? Payment increases 2010-2019
- Taking billions from the public purse, but paying little back in taxes
- Table: Taxes booked 2010-2019; Extendicare, Sienna, Chartwell
- Conclusions and Recommendations
- Appendix: Method of estimation
- Table: Top 10 for-profit firms by number of beds
- Table: Financial information of publicly-listed for-profit LTC owners, 2019
- Table: Estimated revenue and profits, 2019
- About the authors

Photo by Jeremy Wong on Unsplash
Introduction
The COVID pandemic has not only caused a devastating number of deaths among residents of LTC facilities in Ontario and other provinces, it has also exposed a deep divide in the standards of care between for-profit, non-profit long-term care.
The appalling conditions in some facilities that contributed to the spread of COVID and the ensuing tragic consequences have been extensively documented by the Canadian Forces, the Royal Society of Canada, Ontario’s Long-Term Care COVID-19 Commission, health reporter and author André Picard, author and researcher Nora Loreto, other investigative journalists, and in many media reports.[i] While there have been numerous revelations about conditions within different LTC facilities, there have been fewer revelations about where public funding for long-term care has flowed and what it has been used for.
The people of Ontario have a right to know how the almost $6 billion—and growing—in LTC funding that they provide annually is being used, especially since a substantial share of it is not going into care for residents.
It is also critically important to understand why conditions, infections, and deaths have been far worse at for-profit facilities than at not-for-profit and municipal facilities, and whether it is an issue of overall funding, or an issue of where that funding goes.
This report looks at part of that funding picture, focusing on:
- how much public funding is going to for-profit owners of LTC facilities in Ontario;
- how much they have extracted in profit; and
- where some of those profits have gone.
Unfortunately, there is very little transparency about where public funding for LTC ultimately goes, especially within privately-held LTC facilities. As Dr Tamara Daly of York University has said, “In long-term care, we have public funding but private data.”[ii]
The implications of profit extraction from public funds provided to LTC facilities has become glaring during the COVID-19 pandemic. As has been widely reported, COVID-19 death rates in for-profit facilities have been substantially worse than death rates in not-for-profit or municipal facilities.[iii]
One key element of this discrepancy is the fact that, within facilities with deaths, municipal operators were much more successful at containing the spread. In 2020, more than one-third of municipal facilities that experienced a death managed to have just a single death. In comparison, only 15% of for-profit facilities with deaths kept it to one.
This outcome is directly connected to the diversion of public funding to corporate profits because some for-profit facilities have delayed converting multi-bed rooms to safer single-occupancy private rooms.[iv] Instead, they have left residents warehoused in multi-bed rooms while diverting public funding to profits.
This is just one of the more glaring examples of how public funding extracted as profit led to worse outcomes during the pandemic.
The money claimed as profit could have been used to improve accommodations, improve care, and reduce needless infections and deaths.

Photo by Ben White on Unsplash
In 2020, among facilities that had a COVID outbreak with at least one death, the death rate in for-profit facilities was more than three times the rate at municipal facilities, and almost double the rate at not-for-profit facilities.
The 10 largest for-profit owners control 41% of the LTC beds in Ontario, but had 58% of the deaths in 2020.
If for-profit facilities had the same death rate as municipal facilities through 2020, 1,413 fewer people would have died.
Table: Deaths from COVID-19 by ownership type, 2020
|
Facility Type / Company |
Total Facilities |
Facilities with deaths |
Deaths |
Deaths per 1,000 beds |
|
Municipal |
102 |
26 |
196 |
37.6 |
|
Not-for-profit |
162 |
51 |
598 |
68.1 |
|
For-profit |
361 |
111 |
2,049 |
121.1 |
|
Grand Total |
625 |
188 |
2,843 |
92.0 |
Sources: Reports on Long-Term Care Homes; Nora Loreto.[v] / Note: Our calculations are for 2020 and are in line with those calculated by the Toronto Star.[vi]


Billions in public funding going to corporate profits instead of care
A majority of the almost $6 billion that the Ontario government provides annually for long-term care goes to for-profit operators. Approximately one quarter goes to not-for-profit facilities and about one-fifth goes to municipal public facilities.
Core public funding is provided in four envelopes. For-profit owners can claim as profit all money that is unspent from the envelope called "other accommodation". According to the Ministry of Health and Long-term Care, these funds are for things that “will maintain or improve the care environment of the LTC home” such as housekeeping and improving infrastructure. By our estimate, for-profit owners claimed more than half of this envelope as profit instead of improving care.
Unfortunately, there is little public transparency about where the billions of dollars in public funding allocated to for-profit long-term care ultimately goes, and even less transparency about how much money is diverted to the profits of privately-held for-profit facilities.
 Most of the for-profit facilities are privately-held, as opposed to publicly-listed on a stock exchange. These facilities, and their owners, are not required to disclose much information about their finances and use of public funds. While they may be required to report to the government, their finances are essentially a black box as far as the public is concerned. This includes Revera, the largest owner of facilities and beds in Ontario, which is privately-held, although the owner is the Public Sector Pension Investment Board (PSPIB), a Canadian Crown corporation.
Only Extendicare, Sienna and Chartwell—the second, third, and fourth largest LTC facility owners in Ontario, respectively—are required to make their financial information publicly available because they are publicly-listed. Together, they own 99 long-term care facilities in Ontario. This is more than a quarter of the province’s for-profit facilities, with more than a third of the for-profit beds.[vii]
Due to a lack of transparency on how public funding is used by LTC facilities, and the extreme lack of transparency about the privately-held for-profit companies, it has been necessary to estimate the amount of profit being diverted. The method and sources for our estimation can be found in the appendix.

Photo by Tima Miroshnichenko from Pexels

Public funding of long-term care
Most of Ontario’s annual operating funding for LTC facilities flows through four separate envelopes on a per diem Level of Care (LOC) basis for each bed.
These four envelopes are:
- Nursing and Personal Care
- Program and Support Services
- Raw Food
- Other Accommodations
The Ontario government also provides a “supplementary transfer” to subsidize the construction of new and redeveloped beds, property tax payments, and other costs. As of 2019 the supplementary transfer was valued at $16.65 to $23.03 per bed per day.
The legislated base and actual funding per bed for each of these funding envelopes in 2019 was as follows:
Table: LOC funding envelopes and actual transfers, 2019
|
Envelope |
Base funding per year per bed |
Actual transfer (millions) |
Actual average transfer per year per bed |
|
Nursing and Personal Care |
$37,354 |
$2,919 |
$36,962 |
|
Program and Support Services |
$4,402 |
$279 |
$3,539 |
|
Raw Food |
$3,482 |
$268 |
$3,394 |
|
Other Accommodations |
$20,630 |
$1,595 |
$20,197 |
|
Total LOC Funding |
$65,868 |
$5,062 |
$64,098 |
|
Supplementary transfer |
|
$764 |
$9,674 |
|
Total Transfer |
|
$5,826 |
$73,772 |
Sources: Ministry of Health and Long-term Care; Financial Accountability Office of Ontario; Reports on Long-Term Care Homes. / Note: Figures may not sum due to rounding. Base funding per year is calculated as funding per day multiplied by 365. Actual annual transfer per bed is based on a total of 78,973 beds (see below).
Additional funds may be provided if facilities have higher needs patients or if the facilities are smaller. Conversely, funds are clawed back if beds are not sufficiently occupied, or if funds are not completely spent in each of the first three envelopes.
Under Ontario’s funding model, for-profit owners can take profits only from the "other accommodation" funding envelope. Unlike other envelopes, these funds are not restricted to expenses like wages and salaries for nursing and care staff or food.
Rather, the funding is meant for things like housekeeping, food service, worker recruitment, property maintenance, and other “facility costs that will maintain or improve the care environment of the LTC home”.[viii] However, because the funds are unrestricted, money not spent to improve the care environment can be claimed as profits.
A majority of both the facilities and beds are owned and operated by for-profit companies, as seen in the following table.[ix]
Table: LTC facilities and beds by ownership type, 2019
|
Facility Type |
Number of Facilities |
% of total |
Number of Beds |
% of total |
|
Municipal |
102 |
16% |
16,277 |
21% |
|
Not-for-profit |
162 |
26% |
20,438 |
26% |
|
For-profit |
361 |
58% |
42,258 |
54% |
|
TOTAL |
625 |
100% |
78,973 |
100% |
Source: Reports on Long-Term Care Homes. / Note: Percentage figures may not sum due to rounding
According to the government’s online database, as of 2019, there were 361 publicly funded for-profit LTC facilities in Ontario with a reported 42,258 beds, representing 58% of all facilities and 54% of all the beds.
Not-for-profit facilities represent the next largest share with 26% of the total number of facilities and beds.
Publicly-owned and operated municipal facilities comprise the remainder, with 16% of all facilities and 21% of all beds.
On average, publicly-owned municipal facilities are larger. Municipal facilities have an average of 160 beds, while there are an average of 126 beds in each not-for-profit facility and 117 beds in each for-profit facility. However, the four largest chains—Revera, Chartwell, Extendicare, and Sienna—tend to have larger facilities, with an average of 136 beds in each.
Using the number of beds by facility type and the average actual transfers per bed, the following table presents the estimated public funding provided within each funding envelope to each type of facility in 2018-19.
Table: Provincial public funding by envelope for different types of long-term care facilities, 2018-19
|
|
Municipal |
Not-for-profit |
For-profit |
Total |
||
|
|
# of Facilities |
102 |
162 |
361 |
625 |
|
|
|
# of Beds |
16,277 |
20,438 |
42,258 |
78,973 |
|
|
|
Nursing and Personal Care |
$602 |
$755 |
$1,562 |
$2,919 |
|
|
|
Program and Support Services |
$58 |
$72 |
$149 |
$279 |
|
|
|
Raw Food |
$55 |
$69 |
$143 |
$268 |
|
|
|
Other Accommodations |
$329 |
$413 |
$853 |
$1,595 |
|
|
|
Supplementary Transfer |
$157 |
$198 |
$409 |
$764 |
|
|
|
Total Revenue (millions) |
$1,201 |
$1,508 |
$3,117 |
$5,826 |
|
Note: Estimated amounts; dollar figures in millions

Photo by Önder Örtel on Unsplash
Profits diverted from Ontario LTC
We estimate that between 2010 and 2019, Ontario’s for-profit LTC facilities have extracted over $3.8 billion from public funding for long-term care. Our calculations show that amount is growing. In 2019 alone $440 million in public funding was funneled to profit.
These profits from public funding comprise 7.5% of the Ontario government’s annual funding for LTC. Further, this money is over half of the unrestricted funds in the “other accommodation” envelope. In other words, in the decade before the pandemic, for-profit LTC owners rewarded themselves with billions instead of spending the money to improve their facilities.
Other accommodation envelope
The “other accommodation” envelope is 31% of LOC funding. The funding is meant to cover a variety of important duties, including the salaries for employees performing services like housekeeping and maintenance.
Although services like housekeeping and maintenance are not front-line provision of care, the pandemic made it obvious that they are essential to proper operation of a LTC facility. Disturbing stories of LTC facilities suffering COVID-19 outbreaks routinely describe unhygienic conditions, including lack of disinfection, rotting food left in common areas, lack of laundry and linens, and many other problems related to under-provision of services funded through the “other accommodation” envelope.[x] The kind of work funded through the envelope should be considered essential to making “long-term care homes a better place to live and work.”[xi] If personal support workers and registered nurses working at LTC facilities are to do their jobs effectively, and provide the care our elders deserve, they require the support of workers who improve and maintain the infrastructure of care.
Recruitment is also identified as one use for the “other accommodation” funding. As unrestricted funds, the money could be used to provide bonuses or other incentives to attract workers and ensure adequate staffing.
Longer-term profit diversion
In the table below, we use the growth in Local Health Integration Network (LHIN) funding of LTC facilities, as reported in Ontario’s Public Accounts, to estimate the revenue going to for-profit owners.[xii] We combine that with the average annual profit margin of Chartwell, Extendicare, and Sienna to estimate the profits extracted.
Over the last ten years, for-profit owners have diverted $3.8 billion in public funding for care in LTC facilities into profits, dividends, and executive compensation for these owners of for-profit facilities.
Table: Public funding for LTC diverted to corporate profits
|
Year |
Estimated Revenue |
Profit Margin |
Estimated Profits |
|
2010 |
$2,283.19 |
14.5% |
$331.77 |
|
2011 |
$2,416.34 |
13.9% |
$336.20 |
|
2012 |
$2,579.47 |
15.6% |
$401.26 |
|
2013 |
$2,623.21 |
13.4% |
$352.40 |
|
2014 |
$2,724.97 |
13.2% |
$358.46 |
|
2015 |
$2,812.94 |
13.2% |
$370.06 |
|
2016 |
$2,874.07 |
13.4% |
$385.25 |
|
2017 |
$2,925.58 |
14.0% |
$410.11 |
|
2018 |
$3,000.43 |
14.0% |
$421.22 |
|
2019 |
$3,117.46 |
14.1% |
$439.66 |
|
Total |
$27,357.66 |
13.9% |
$3,806.40 |
Notes: Calculated using data from Ontario Public Accounts, and financial reporting of Chartwell, Extendicare, and Sienna. / Dollar figures in millions; 2010-19
Profits in long-term care
Asset management and investment research companies promote the profitable potential of the so-called “silver economy”, including the LTC sector.[xiii] As a recent report from Public Services International highlights, the sector is increasingly attracting financial actors, like asset management companies, seeking ever higher returns on their investments.[xiv]
When Chartwell and Sienna offered shares to the public, in 2003 and 2010, respectively, both companies explained why LTC facilities are profitable assets. Among the reasons given is the “stability of revenue” due to “high occupancy levels” and “government funding”. Sienna touted the fact that our elders, once they have moved into a facility, “are reluctant or unable to move”. Both companies also noted that the industry has high barriers to entry, which ensures that competition is limited. A long waiting list for LTC beds is taken by for-profit owners as a “favourable industry fundamental,” because it means there is excess demand. The shortage of beds was cited by Chartwell during the company’s earnings call for the third quarter of 2020.[xv]
The companies present the certainty and stability of government funding to investors as a good thing. However, government spending on LTC is capped by a funding formula, while accommodation costs are set by the government. This means the revenue of LTC owners is constrained. Therefore, profit must be extracted primarily by cost-cutting.
In competitive industries, cost-cutting can lead to the loss of customers who seek products and services from other providers, or to the loss of workers that seek employment elsewhere. However, as the for-profit LTC owners note, this is not a concern for them. Cost-cutting is facilitated by the existence of excess demand and low turnover; residents are effectively trapped for the rest of their lives.

Photo by Razvan Chisu on Unsplash
Analysis of publicly traded for-profit LTC companies
Of the 70 for-profit LTC companies that we identified, only those with publicly-traded shares— Chartwell, Extendicare, and Sienna—are required to make their financial information publicly available. The three companies own 99 of Ontario’s 361 for-profit facilities. Only Revera controls more of Ontario’s for-profit beds.
Unfortunately, despite being fully-owned by a Crown corporation, Revera’s financials are not made public. A report from the Centre for International Corporate Tax Accountability and Research (CICTAR) that detailed Revera’s extensive use of tax havens had to rely on data from the UK.[xvi]
The following sections examine the dividends of the three publicly-listed companies, as well as their compensation of executives and board members. Unfortunately, this information for the privately-held for-profit companies that control 73% of the LTC facilities in Ontario.
Dividends
In their prospectuses, Chartwell and Sienna promised prospective investors a lucrative return on their investments. They delivered. From 2010 through 2021, Chartwell, Extendicare, and Sienna distributed a combined $2.3 billion to shareholders.[xvii]
In 2020, the three companies paid out a then-record high total of $235 million in dividends. All three paid out even more in 2021, totalling $242 million. Board members collected at least $6.8 million in dividends in 2020.
The $477 million in dividends paid to the shareholders of the three companies during the pandemic could have paid for over 4,500 full-time personal support workers at $25/hr in 2020 and 2021.
Chartwell and Extendicare both explain in their financial disclosures that executive and director compensation is designed to align management’s interests with the interests of shareholders.[xviii] This is why a portion of the money paid to an executive depends on the performance of the company’s shares. The companies want their management to identify with the shareholders, with no similar incentives to get them to identify with residents or workers.
For example, 63% of the Sienna CEO’s salary consists of “share-based awards,” while 52% of all executive compensation is tied to financial performance. Nothing in their compensation is contingent with improving care, or reducing infection and death rates in their facilities.
Executive and Board compensation
In 2019, the three companies paid over $17 million to their top executives and board members. Executive and board compensation has increased substantially over the previous decade. As seen in the chart below, between 2010 and 2019, the compensation of the Chairs of the Board has increased 60%, while the compensation of the CEOs has increased by a whopping 102%. Contrast that with the public funding of LTC, which increased by a comparatively meagre 37%.[xix]
Compensation of executives and board members has even outpaced profit and dividend growth, although both have greatly exceeded LTC spending. The operating profit of Chartwell, Extendicare, and Sienna’s LTC segments increased 55%. Dividend payments increased 51%. The three companies were squeezing more profits out of the public funding going to their facilities, with a growing share of that money ending up in the pockets of board members and executives.
This trend did not slow with the pandemic. In 2020, board members of the publicly-listed LTC companies collected at least $6.8 million in dividends. Of that, $849,000 went to the CEOs. That is on top of their salaries and any share-based compensation they received. The companies rewarded their top executives even as 751 residents of their LTC facilities died of COVID-19.

Who got the money?
Payment increases 2010-2019 (millions)
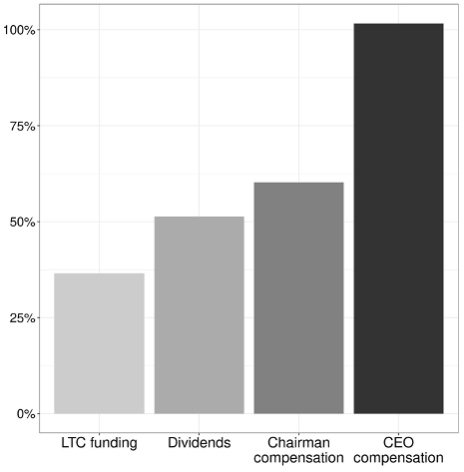
Note: Comparison of increase in public funding of LTC with increases in dividend payments, and compensation of board chairmen and CEOs between 2010 and 2019.

Mike Harris by Sheila Steele via Flickr, CC BY-NC-SA 2.0
Former Ontario Premier Mike Harris is Chartwell’s Chairman of the Board. In 2020, Harris owned 511,095 units (and equivalents) of Chartwell. This means he was entitled to over $311,256 in dividends, in addition to his director’s fee of more than $200,000, while over 150 Chartwell residents died of COVID. The dividend payment Harris was entitled to could have paid for almost six full-time care workers.
Taking billions from the public purse, but paying little back in taxes
Canadian corporations have significantly reduced their income taxes throughout the post-war era. This can be attributed both to lowered rates by governments and more aggressive tax avoidance measures by corporations.[xx]
Even within this context of falling tax rates, Chartwell, Extendicare, and Sienna have outperformed their peers at reducing their taxes.[xxi]
However, there has also been substantial divergence among the three companies. The effective tax rate (ETR) from 2010-9 among Canadian corporations averaged 20.3%. Extendicare’s ETR over this period was much lower at 9%. Sienna’s effective tax rate was almost non-existent at just 1.3%. Meanwhile, Chartwell paid no overall taxes primarily because it is structured as a real estate investment trust (REIT), and REITs pay no corporate income tax.
Over the ten years of our analysis, while Extendicare and Sienna both booked some tax expenses, Chartwell had net tax benefits for an ETR of -1.1%. That means although in some years Chartwell recorded taxes owed, in other years the company was able to record a tax credit. If we sum all of its taxes owing and rebated between 2010 and 2019, Chartwell has been able to defer and write-off more taxes than they have paid.
Paper losses and tax benefits
Part of Sienna and Chartwell’s extraordinarily low ETRs is from recording pre-tax losses in several years. Although they had positive operating income, once they accounted for additional costs like amortization and depreciation, they showed paper losses. This allowed them to record tax benefits, which they were able to apply against taxes expensed in subsequent years.
Companies are able to use many means of recording losses and booking net tax benefits. We will examine just two.
Example 1: In 2012, Chartwell took an impairment charge of $21.2 million after the assessed value of several properties were lowered. Chartwell continued to own and operate the properties, but because their paper value was deemed to be lower than previously accounted for Chartwell was able to count the difference as a loss. The company also recorded a $49.3 million loss in the value of its financial assets. Chartwell was also able to claim $127.2 million in financing expenses, the majority of which are mortgage repayment. In other words, because the company could expense its borrowing costs and reduce its tax responsibilities, the public is subsidizing Chartwell’s acquisition of LTC facilities, and thus also subsidizing concentration within the LTC sector. Altogether, in 2012, Chartwell recorded a pre-tax loss of $161 million and a net tax benefit of $22 million.
Example 2: In 2014, Sienna booked an extraordinary expense of $18.4 million for a premium paid to repurchase $294 million of the company’s debt. As the company described it, this re-purchase “created a tax shield of $1.7 million.”[xxii] In plain English, buying back the debt enriched Sienna’s lenders by $18.4 million and reduced the company’s taxes by $1.7 million. That means taxpayers subsidized almost 10% of the cost.
During the years when Chartwell and Sienna recorded losses, neither company interrupted their dividend payments. For example, in 2012 when Chartwell recorded its pre-tax net loss of $161 million, it still paid out $87.5 million to unitholders. In 2014, Sienna paid out $32.1 million to its shareholders. This is completely legal, which raises questions about how tax authorities account for corporate profits, and what sorts of expenses can be deducted for tax purposes. For example, share-based compensation can be included in expenses that reduce balance sheet income. Companies can also expense the interest paid on mortgages used to finance facility acquisitions. The public can end up subsidizing consolidation in the long-term care business.
For-profit LTC in tax havens
At least two of these large for-profit chains also established subsidiaries based in offshore tax haven countries, presumably to reduce taxes on their global operations.
As the report from CICTAR, Tax Dodging by a Crown Corporation: Making a Killing has revealed, Revera has engaged in aggressive tax avoidance with its UK operations and appears to have dozens of affiliated companies based in the tax havens of Jersey, Guernsey and Luxembourg.[xxiii] Revera very well may engage in similar tax dodging schemes with its Canadian operations, but we do not know because there is very little transparency required of privately-held corporations in Canada and Revera discloses very little of its own accord.
Extendicare Canada maintained two fully-owned subsidiaries registered in both Bermuda and Barbados—LTC Professional Corp and Laurier Indemnity—that acted as “captive insurance” operators for some of Extendicare’s operations in the U.S. Establishing wholly-owned insurance subsidiaries in tax havens that only provide insurance for operations of the parent company has been a widely used tax avoidance scheme. It enabled businesses to shift profits through the premiums they pay to their own subsidiaries. By putting the captive insurance subsidiaries in tax havens, they eliminate much, if not all, of the tax on the shifted profits. Because Canada has tax treaties with these havens, parent corporations have been able to bring profits back to Canada tax-free.
This had been such a widely used tax dodging scheme that the US International Revenue Service included it as one of their top “dirty dozen tax scams”.[xxiv] The OECD also recently issued guidance on transfer pricing of financial transactions that are intended to limit abuse of captive insurance subsidiaries to dodge taxes—which may be why Extendicare appears to have recently stopped use of these subsidiaries.[xxv] While many different corporations have used this tax dodge, it is especially galling that corporations such as Extendicare, which derive so much of their revenue from tax supported public funding, turn around and minimize their own taxes.
Taxes avoided
The effective tax rate for Canadian companies has fallen dramatically since the 1980s. Chartwell, Extendicare, and Sienna have pushed their effective tax rates down even further. If the three publicly-traded companies had booked taxes at the average effective corporate tax rate, they would have contributed almost half a billion dollars more to public funds. Extendicare would have paid an additional $156 million, Sienna would have paid an additional $132 million, while Chartwell would have paid an additional $146 million.
Table: Taxes booked 2010-2019 (millions)
|
Company |
Taxes booked |
If taxed at average Canadian ETR |
|
Extendicare |
$119.6 |
$276.0 |
|
Sienna |
$9.4 |
$141.8 |
|
Chartwell |
-$7.3 |
$139.1 |
Source: Financial reports of Chartwell, Extendicare, and Sienna; Statistics Canada table 33-10-0007-01
Unfortunately, we do not know how much tax was paid by the remaining for-profit owners of Ontario’s LTC facilities because of the extreme lack of transparency.

Photo: Piggy Bank Travel by Roderick Eime via Flickr (CC BY-ND 2.0)
Conclusions and Recommendations
The majority of LTC beds operated in Ontario are through for-profit companies that are provided with billions in public funding. It is abundantly clear that for-profit providers prioritize profit over quality of care. This has resulted in unnecessary death and suffering during the COVID-19 pandemic while almost $4 billion dollars of public money was funnelled into corporate profits over the past decade. Compounding this human tragedy, there is strong evidence that the largest for-profit providers in Ontario pay little in taxes themselves, while taking advantage of weak transparency laws to hide their finances from the public. Placing profit before care and avoiding fair taxation have no place in a healthy, high-quality and publicly funded long-term care system.
 There needs to be much more transparency on how public funding for LTC is spent. This would provide Ontarians, as well as health experts and patient advocates, the information they need to ensure that funds are being used to provide critical care for seniors and vulnerable people—and not funneled to corporate profits, dividends, and compensation for highly paid executives and corporate directors.
Recommendation 1: Require all for-profit LTC operators to publicly disclose relevant financial, ownership, and employment information, including revenues, profits, taxes paid, executive salaries, and dividends. Facility level information on the use of public funds and staffing should also be disclosed.
Public funding for LTC will increase substantially in coming years, both as a result of our aging population and the need to improve care. When those funds are directed through for-profit corporations, taxation ensures that a portion of their profit goes back into funding more quality long-term care. Federal and provincial governments must therefore take steps to ensure that the for-profit corporations that receive public funds for long-term care are not allowed to avoid paying their fair share of taxes.
Recommendation 2: Close loopholes that allow corporations receiving public funding to engage in aggressive tax avoidance schemes—such as the use of subsidiaries in tax havens, or the REIT structure—that provide tax breaks with no public benefit. Pending this closure, require for-profit operators to sign an agreement not to engage in aggressive tax avoidance.
Ontario’s Long-Term Care COVID-19 Commission recommended that long-term care be provided by organizations that are “mission-driven rather than motivated by dividends.”[xxvi] Evidence highlighted in numerous reports concludes that the standard of care is too often lower in for-profit settings. Ontario can substantially improve its LTC system by shifting the ownership of facilities, as well as operation and provision of LTC, to the exclusive domain of non-profit organizations, which prioritize care over profits. If for-profit operators are involved, they will always prioritize profits over care, and hundreds of millions of taxpayer dollars in funding will continue to be diverted from the public into profits every year.
Recommendation 3: Create a plan to shift all publicly funded long-term care facilities to nonprofit operators.

Photo by Branimir Balogović on Unsplash
Appendix: Method of Estimation
To estimate how much of Ontario’s public funding for LTC has been diverted to corporate profits, we combined data and information from: 1) Ontario’s online database Reports on Long-Term Care Homes, 2) the Ontario Ministry of Health and Long-Term Care, 3) Ontario’s Financial Accountability Officer (FAO), 3) Ontario’s Public Accounts, and 4) the financial reporting of Chartwell, Extendicare, and Sienna, as well as the disclosures from Retirement Residences Real Estate Investment Trust, predecessor of Revera Inc.[xxvii]
Number of facilities and beds
The database we used listed 651 facilities.[xxviii] An FAO report on long-term care states that there are 626 facilities.[xxix] Ten of the facilities reported in the database have no beds. Another 16 facilities appear to be located at hospitals. When those are eliminated, we are left with 625 facilities.
The FAO report states that in 2018 there were 78,664 beds. The database we used listed a total of 79,521 beds at the 641 active facilities. Hospital-located facilities listed 548 beds. Once those are subtracted, we are left with 78,973 beds, a difference of 0.4% over the FAO figure.[xxx]
Our analysis focuses on for-profit facilities, although several not-for-profit and municipal facilities are operated by for-profit companies. We also used data on the municipal and not-for-profit facilities to compare for-profit performance managing the pandemic.
For-profit revenues and profits
Using the number of beds by facility type, we can estimate the amount of revenue within each funding envelope received by each type of facility in 2018-19.
In 2018-19 for-profit long-term care facilities had a pool of $853.48 million from which to divert profit. To calculate how much they actually diverted, we used financial data from Chartwell, Extendicare, and Sienna, which shows an average operating profit margin in 2019 of 14.1%. If we take this as indicative of the entire for-profit LTC business, then the profits diverted totalled $439.56 million.[xxxi]
Firm level profits
We can use the number of for-profit beds owned or operated by each company to estimate the amount of profit each diverts from the "other accommodation" envelope. We identified a total of 70 different companies owning or operating for-profit facilities, although some may have a shared parent that could not be identified due to a lack of transparency about long-term care facility ownership. Of the 70 companies, 42 have just one facility. Another 18 have between two and seven facilities. The following list is the top ten companies ordered by number of beds. The list also includes the number of COVID deaths at their facilities from the start of the pandemic through December 31, 2020.
Table: Top 10 for-profit firms by number of beds
|
Company |
Facilities |
Beds |
Deaths |
|
Revera |
52 |
6,022 |
352 |
|
Extendicare |
40 |
5,818 |
233 |
|
Sienna |
34 |
5,526 |
369 |
|
Chartwell |
25 |
3,256 |
149 |
|
Schlegel |
18 |
2,526 |
117 |
|
Southbridge |
27 |
2,486 |
177 |
|
Responsive |
16 |
2,394 |
166 |
|
OMNI |
18 |
1,487 |
41 |
|
Jarlette |
14 |
1,487 |
22 |
|
Caressant |
15 |
1,276 |
16 |
These ten companies own or operate 72% of all for-profit facilities, have 76% of the for-profit beds, and have had 80% of all deaths in for-profit facilities. Overall, they own 41% of Ontario’s LTC facilities, control 41% of all beds, and have had 58% of all deaths.
Table: Financial information of publicly-listed for-profit LTC owners, 2019
|
Company |
Revenue |
Operating Expenses |
Operating Profits |
Profit Margins |
|
Chartwell |
$239.61 |
$207.95 |
$31.66 |
13.2% |
|
Extendicare |
$643.79 |
$566.38 |
$77.41 |
12.0% |
|
Sienna |
$516.43 |
$428.07 |
$88.36 |
17.1% |
Note: Dollar values in millions
Chartwell, Extendicare, and Sienna
For 2019, the reported LTC revenue, operating expenses, operating profits, and profit margins of Chartwell, Extendicare, and Sienna were:
Chartwell’s long-term care segment is entirely composed of Ontario facilities, so we have the exact figure for how much profit it extracts. However, this also allows us to test our method of using the number of beds and the average per bed transfer to estimate revenue from ownership of Ontario LTC facilities.
Chartwell has 3,256 beds for an estimated revenue of $240.2 million, which is just 0.2% higher than its reported revenue of $239.61 million. Chartwell’s reported operating profits are 48.1% of the estimated revenue coming from the “other accommodation” envelope.
Using our method and the companies’ reported LTC profit margins, we calculate the profits from Ontario LTC going to Extendicare and Sienna are $51.6 million and $69.7 million, respectively. These figures mean that Extendicare diverts 43.9% of the “other accommodation” envelope, while Sienna is diverting 62.5%.
Revera
The largest owner of Ontario LTC facilities is Revera. Revera was previously known as Retirement Residences REIT and was publicly traded until early 2007. Retirement REIT filed its last annual report for 2005, which included data on its Canadian LTC operations. That year, it had an operating profit margin of 17%.
Revera’s average profit margin for 2002-5, all the years for which we have segment information, was 17.1%, ranging from 16.0% to 18.2%. If we take the average and apply it to the estimated revenue, Revera’s operating profit for 2019 was $76 million.
Remaining top 10
The estimated combined profits from Ontario LTC of Chartwell, Extendicare, Revera, and Sienna were $228.93 million. Using the assumed 14.1% profit margin for the industry, the remaining profit available for the other 66 companies is $210.55 million, which implies a profit margin of 13.2%. In the table below, we apply this profit margin to the estimated revenue of the remaining six members of Ontario’s Top 10 for-profit long-term care owners.
Table: Estimated revenue and profits, 2019
|
Company |
Revenue |
Profits |
|
Schlegel |
$186.35 |
$24.58 |
|
Southbridge |
$183.40 |
$24.19 |
|
Responsive |
$176.61 |
$23.29 |
|
OMNI |
$109.70 |
$14.47 |
|
Jarlette |
$109.70 |
$14.47 |
|
Caressant |
$94.13 |
$12.42 |
Note: Dollar values in millions
Alternative data sources
One possible source is Statistics Canada data on private nursing and residential care facilities, which includes long-term care.[xxxii]In 2018, the reported profit margin was 7.8%. Applied to the total transfer of for-profits, the estimated profits in 2018-19 were $243.16 million, or 28.5% of the “other accommodation” envelope. However, we know from the financial statements of Chartwell, Extendicare, and Sienna that their combined operating profits for 2019 were $197.43 million. That would leave just $45.73 million for all the remaining companies, including the largest operator, Revera.
An alternative source of an industry-wide profit margin is Industry Canada’s Canadian Industry Statistics (CIS), which includes the average revenue and expenses of small and medium sized businesses, defined as those with fewer than 500 employees.[xxxiii]
Data is shared for quartiles on the basis of revenue, capped at $5 million. Our calculations suggest that this would include the bottom 21 of 70 identified for-profit owners operating in Ontario. We calculated the average operating profit margin for the largest cohort among the SMEs, those with revenue between $623,000 and $5 million, at 17.2%.[xxxiv]
Applied to the revenue from Ontario spending going to for-profits suggests that $535.27 million is being diverted. However, the data from CIS shows that the profit margin falls as business revenue grows. Since most of the beds are owned by larger operators, we decided that 14.1%—the average calculated from Chartwell, Extendicare, and Sienna, is a suitable—though conservative—estimate of the industry profit margin.
About the Authors
Dr. DT Cochrane has a graduate degree in economics, as well as in social and political thought. He has researched and written about a range of topics including pipeline finance, big tech, and corporate power. Although he grew up on a ranch in Saskatchewan, DT currently lives in Peterborough with his partner and children. When he's not figuring out new ways to use pivot tables, he can be found reading fiction, taking photos, and trying to enjoy outdoor activities.
Toby Sanger is the former Executive Director of Canadians for Tax Fairness. He has been a widely respected Canadian economist for over 30 years, working previously as economist for the Canadian Union of Public Employees, as chief economist for the Yukon, as principal economic adviser to the Ontario Minister of Finance, as economic adviser to First Nations, and as an environmental economist. Prior to that, he also worked as a baker, in a circus, and as a journalist. He lives in Ottawa.
Canadians for Tax Fairness (C4TF) is a non-profit, non-partisan organization that advocates for fair and progressive tax policies, aimed at building a strong and sustainable economy, reducing inequalities, and funding quality public services.
Endnotes
[i] https://www.macleans.ca/wp-content/uploads/2020/05/JTFC-Observations-in-LTCF-in-ON.pdf; https://rsc-src.ca/sites/default/files/LTC%20PB%20%2B%20ES_EN_0.pdf; https://files.ontario.ca/mltc-ltcc-final-report-en-2021-04-30.pdf; https://www.cbc.ca/books/neglected-no-more-1.5899742; https://www.macleans.ca/news/canada/the-covid-outbreaks-that-ontario-wasnt-counting/; https://www.thestar.com/news/gta/2021/06/12/covid-19-deaths-piled-up-as-this-ltc-home-missed-deadlines-to-fix-infection-control-prevention-problems-this-was-the-governments-pathetic-response.html; https://www.theglobeandmail.com/canada/article-it-took-a-pandemic-why-systemic-deficiencies-in-long-term-care/; https://www.cbc.ca/news/canada/ottawa/canada-record-covid-19-deaths-wealthy-countries-cihi-1.5968749; https://toronto.ctvnews.ca/improve-working-conditions-in-long-term-care-homes-covid-19-advisory-group-urges-1.5275102;
[ii] Quoted in Andre Picard, Neglected No More, p. 58.
[iii] Extendicare also had at least 88 deaths at not-for-profit facilities that it manages, while Chartwell had 14 deaths at not-for-profit facilities that it manages. However, this analysis focuses just on facilities that are also owned by for-profit companies.
[iv] https://www.cbc.ca/news/health/covid-19-coronavirus-long-term-care-home…
[v] Loreto updates daily data on deaths in LTC, other residential care facilities, and workplaces. https://docs.google.com/spreadsheets/u/0/d/1M_RzojK0vwF9nAozI7aoyLpPU8E…
[vi] https://www.thestar.com/politics/provincial/2021/01/20/ontarios-for-profit-nursing-homes-have-78-more-covid-19-deaths-than-non-profits-report-finds.html
[vii] Combined with Revera, these companies operate close to half (49%) of all the for-profit long-term care beds in Ontario.
[viii] Ministry of Health and Long-term Care, “Guidelines for Eligible Expenditures for Long-Term Care Homes”, p. 13.
[ix] We excluded hospital-located beds and facilities from our analysis.
[x] See the Canadian Armed Forces Joint Task Force Central, May 20, 2020, “JTFC Observations in Long Term Care Facilities in Ontario”, https://www.macleans.ca/wp-content/uploads/2020/05/JTFC-Observations-in-LTCF-in-ON.pdf
[xi] This was a key recommendation of the Ministry of Health and Long-term Care’s “Long Term Care Staffing Study” responding to the Ontario government’s “Public Inquiry into the Safety and Security of Residents in the Long-term Care Homes System”, https://www.ontario.ca/page/long-term-care-staffing-study
[xii] LHIN transfers include just the LOC funding. Based on differences between the Financial Accountability Officer’s report for 2018-19 and the LHIN reported value for 2018-19, LHIN figures appear to be net of residence co-payments, which return money to the province.
[xiii] For example: Stockhouse, “Global Long-term Care Industry”, September 2020, https://stockhouse.com/news/press-releases/2020/09/29/global-long-term-…; Accenture, “The Silver Economy—Is There Potential for Insurers?”, January 2019, https://insuranceblog.accenture.com/the-silver-economy-emerges-is-there…; Rothschild & Co, “The Silver Economy”, Fourth quarter 2019, https://www.rothschildandco.com/siteassets/publications/rothschildandco/private_wealth/2019/switzerland/wm---investment-views---the-silver-economy-2019.pdf
[xiv] https://publicservices.international/resources/publications/care-givers-and-takers---how-finance-extracts-wealth-from-the-care-sector
[xv] During his presentation to investors, CEO Vlad Volodarski noted the “continuing severe shortage of long-term care beds” as a factor that would “support our occupancy recovery.”
[xvi] https://cictar.org/tax-dodging-by-a-canadian-crown-corporation/
[xvii] Technically, the owners of Chartwell are known as ‘unitholders’ because it is a real estate investment trust and investors acquire units rather than shares. We will use the more familiar terms of ‘shares’ and ‘shareholders’ unless discussing just Chartwell.
[xviii] See for examples, Chartwell, “Notice of Annual Meeting of Unitholders and Information Circular,” 2018; Extendicare, “Interim Condensed Consolidated Financial Statements and Notes,” 2020Q3.
[xix] This is based on LHIN transfers to LTC facilities.
[xx] https://www.taxfairness.ca/en/resource/report-january-7th-corporate-inc…
[xxi] The Canadian average is calculated using financial data for thousands of corporations.
[xxii] Sienna, “Consolidated Financial Statements,” 2014.
[xxiii] https://cictar.org/wp-content/uploads/2021/01/Revera_Report_7-1.pdf
[xxiv] https://www.irs.gov/newsroom/irs-2018-dirty-dozen-tax-scams-abusive-tax-shelters-make-the-list
[xxv] https://www.oecd.org/tax/beps/transfer-pricing-guidance-on-financial-transactions-inclusive-framework-on-beps-actions-4-8-10.pdf
[xxvi] https://files.ontario.ca/mltc-ltcc-final-report-en-2021-04-30.pdf, p. 89.
[xxvii] Information on individual facilities is available at https://publicreporting.ltchomes.net. Reports from the FAO can be found at https://www.fao-on.org/en/Publications_update. Ontario’s Public Accounts archive is available at https://www.ontario.ca/page/public-accounts-ontario-past-editions. The financial disclosures of Chartwell, Extendicare, Sienna, and Retirement Residences Real Estate Investment Trust are available through https://sedar.com. Relevant documents from the Ministry of Health and Long-Term Care were gathered from a variety of sources. All documents are publicly available and assistance in identifying them was provided by Ministry of Health and Long-term Care officials.
[xxviii] Statistics Canada reports 653 businesses with employees classified as “nursing care facilities” (Table 33-10-0222-01).
[xxix] https://www.fao-on.org/en/Blog/Publications/ontario-long-term-care-prog…
[xxx] Beds located at facilities associated with a hospital but located off-site are funded like other LTC beds. However, our database was unable to distinguish between in-hospital beds and beds in hospital-affiliated facilities.
[xxxi] Alternative data sources from Statistics Canada and Industry Canada suggest a range of industry profit margin from 7.8% to 17.1%. These alternative sources are discussed below. We rejected the lower bound based on the publicly available data in the financial disclosures of Chartwell, Extendicare, and Sienna.
[xxxii] Statistics Canada. Table 13-10-0102-01. Private nursing and residential care facilities, summary statistics.
[xxxiii] Industry Canada. https://www.ic.gc.ca/app/scr/app/cis/
[xxxiv] Our report used net operating income before interest, taxes, depreciation, and amortization as the basis for calculating profit margins. This is a common financial metric. It also captures the profits after expenditures most directly related to operating long-term care facilities. CIS
==
Note: This Report is licensed under a Creative Commons Attribution-NonCommercial 4.0 International License (CC BY-NC 4.0).
