Summary
Some of Canada’s largest corporations took significant amounts in pandemic-related wage subsidies while reaping record profits, sending billions of dollars to shareholders, and avoiding billions in taxes. For many of these companies, it is not known exactly how much direct pandemic support they collected.1
In March 2020, the federal government introduced the Canada Emergency Wage Subsidy (CEWS) to help and encourage businesses to retain employees during the pandemic. However, the conditions for receiving CEWS were both broad and overly lax.2 Although the multibillion dollar, publicly-funded program kept many workers attached to their jobs, some highly profitable companies took advantage of it while bolstering their value through tax avoidance, dividend payments, share buybacks and acquisitions. Some of the companies even reduced their employment.3
In October of 2022, we released a study showing that Canada’s largest publicly traded corporations were profiting from an increasing “tax gap” that cost governments at least $30 billion in 2021. The “tax gap” is the difference between how much a taxpayer actually pays in tax, and how much they would pay at the statutory tax rate—the rate stipulated in the tax code (see definition of tax gap).
In this study, we take a closer look at companies that had a total tax gap of $100 million or more for 2017-21 to assess their use of CEWS and connected value bolstering techniques. For these purposes we have investigated the following:4
1) whether or not they received the CEWS,
2) whether or not they have subsidiaries in known tax haven jurisdictions, and
3) how much money they spent on dividends, share buybacks, and acquisitions.5
Our analysis found at least half (37) of the 74 companies with a tax gap of $100 million or more received CEWS directly.6 Another 10 benefited from CEWS indirectly.7 The government neither required disclosure of the amounts that companies received nor did it provide that information itself. That means that we do not know how much public funding most of the individual companies collected through CEWS. However, financial disclosures and other public data sources show that of the 37 companies that directly received CEWS:
- 30 have at least one subsidiary in a tax haven.8
- 34 paid out dividends to shareholders during the pandemic.
- 29 increased their total dividend payout during the pandemic.
- 32 did share buybacks during the pandemic.
- 24 reduced their overall employment in 2020.9
- 16 still had reduced employment in 2021.
In 2020 and 2021, while Canadian workers and their families struggled with extreme economic uncertainty, and the federal government spent unprecedented amounts of money to maintain economic stability, the 37 companies receiving CEWS spent a combined:
- $81.3 billion on dividends.
- $41.1 billion on share buybacks.
- $51.1 billion on acquisitions of other companies.
Dividends, share buybacks, and acquisitions all essentially transfer money from the corporation to equity owners, who are overwhelmingly the wealthiest members of society. While dividends directly send money to a company’s shareholders, share buybacks exchange money for equity shares, and acquisitions provide money to the owners of acquired companies.10
The $173.5 billion spent on dividends, share buybacks, and acquisitions is almost half of the combined gross profit for the CEWS recipients. In contrast, these companies paid a relatively meagre $29.3 billion in taxes while avoiding $20.7 billion.
Unfortunately, we do not know how much many of these companies received from CEWS. This information should be public. However, the tax avoided also constitutes a public subsidy in addition to the money directly received from CEWS. The companies have been able to take advantage of tax breaks provided by the government to retain profit. Whether by shifting profits, using aggressive tax planning, or claiming tax credits, tax avoidance shifts money from the public to these companies.
The 37 companies that received CEWS funding distributed almost six times as much money to wealthy corporate owners as they paid into public accounts. The tax avoided by these companies means the public essentially subsidized 12% of that distribution plus an unknown amount through CEWS.
The amount distributed to owners also stands in stark contrast to the amount of new investment the companies made during the pandemic. Just $16.5 billion—or 4.7% of gross profits—were spent on investment above replacement costs.[11]
Owners also benefited from huge capital gains as most of the companies quickly recovered and surpassed market value lost in the early days of the pandemic. By the end of 2021, the combined market capitalization of the 37 CEWS recipients had increased by 22 percent from 2019, or more than $238 billion.
This report makes several policy recommendations to recover corporate tax revenue for public good, in addition to other tax measures to limit corporate tax avoidance. These include:
- A windfall or excess profits tax on all large corporations to support pandemic recovery efforts.
- A minimum book profits tax to limit tax avoidance.
- An increase of the corporate tax rate from 15% to 20%
- Closing tax loopholes for large corporations: in particular the exclusion on capital gains, which allows corporations to pay less tax
- Ending tax agreements with tax havens to ensure corporate profits are reinvested in Canada
- Improving corporate transparency including public reporting of corporate income and taxes for all medium and large corporations
What is the tax gap?
Canada’s corporate tax gap is the difference between how much tax a company would pay at the statutory tax rate and how much it actually paid. The tax gap results from three forms of tax avoidance: 1) the use of deductions and tax credits, 2) the use of sophisticated tax planning, 3) the evasion of taxes. Unfortunately, we do not know what portion of the tax gap derives from each form.
In 2021, the combined tax gap of Canada’s 123 largest corporations jumped to $30 billion from an average of $13.5 billion during the three years before the pandemic. The increase is partially the result of higher corporate profits. However, corporations were also able to push down their effective tax rate—taxes actually paid as a percentage of pre-tax income—from an average of 19% to 15.3%.
For more information on the corporate tax gap see our October report Unaccountable: How did Canada lose $30 billion to corporations?
Report
Private gains: Higher dividends, share buybacks, and acquisitions
Dividends
Dividends are the primary means by which companies return money to their own shareholders. They are typically paid each quarter.
Only one company among the 37 large corporate CEWS recipients we examined suspended its dividend in the first quarter of 2020 when the pandemic was creating extreme financial uncertainty. That single suspension was short-lived.[12] All others maintained or increased their dividend payouts.
Companies are very reluctant to suspend or reduce dividends because this could cause share prices to fall and the compensation of corporate executives is typically tied to share prices. Although, as the Canadian Centre for Policy Alternatives found, during the pandemic, even when corporate financial performance worsened, many companies revised their bonus formulas to ensure.[13] A fall in share price can also make a company vulnerable to a takeover, which could jeopardize the executives’ jobs.
Despite a fall in sales and gross profits in 2020, the total dividends paid by the CEWS recipients increased by $1.7 billion from 2019 to a total of $39.1 billion. In 2021, total dividends increased further to a total of $42.2 billion. At the same time as these companies were collecting CEWS from the government through different subsidiaries, most were sending even more of their profit to owners as dividends.
Share Buybacks
Share buybacks are an increasingly popular way for corporations to distribute money to owners and prop up share prices. In the first half of the 2000s, the largest Canadian companies spent about 7 percent of gross profits on share buybacks. In the five years before the pandemic, share buybacks consumed over 15% of gross profits.[14]
In 2019, 29 of the 37 CEWS recipients conducted share buybacks, repurchasing $21.2 billion of their own shares. Total buyback value fell in 2020, though companies still spent $13 billion. In 2021, 30 of the companies did buybacks totalling $28.1 billion. Twelve of the companies did their largest ever share buyback during that year. For two of the 37 CEWS recipients, it was their first recorded share buyback.
Acquisitions vs. Investment
Acquisitions are the purchase of existing companies. New investment is spending on property, plants, and equipment beyond replacement costs. New investments are seen as creating new productive capacity in the economy while acquisitions simply transfer ownership of existing productive capacity. Acquisitions are popular with corporate executives as a means to grow and gain market power, without adding productive capacity. They increase corporate concentration and reduce competition.
Acquisition spending as a share of gross profit has been trending higher for decades while net investment has been falling.[15] As noted above, the combined acquisitions of the 37 CEWS recipients has been higher than their net investment since 2015. In 2020-1, 26 of the 37 CEWS recipients spent more on acquisitions than new investment.
Brookfield Asset Management deserves special mention. Among the 37 CEWS recipients, Brookfield has spent more on acquisitions than any other company in every year since 2015, except 2016. Before the pandemic, Brookfield was so aggressively acquiring other companies that it spent more than 100% of its gross profits on acquisitions every year from 2015 to 2019. In fact, Brookfield is responsible for more than half of the total acquisitions by the 37 CEWS recipients from 2015 through 2021, spending $130 billion out of the total $250.5 billion.
Public costs, part 1: Reduced employment, too little new investment
The purpose of CEWS was to help companies that suffered a decline in revenues maintain employment and salaries. However, many of the 37 companies that received CEWS reduced their overall employment in 2020. Almost half still had lower employment in 2021 than in 2019.
The 35 CEWS recipients for which we have consistent employment data had a combined 1.14 million employees in 2019.[16] The 24 companies that reduced their employment in 2020—despite receiving CEWS—employed a combined 661,635 people. They reduced their employment by 39,890 people in the first year of the pandemic. Sixteen of those companies not only remained below their 2019 level of employment but reduced employment by another 8,762 people in 2021.
While the “Canada Emergency Wage Subsidy” program has “wage subsidy” in the title, there was no requirement for the money to be used to pay wages or retain employees. The program requirements were that if revenue fell by a certain amount you became eligible for the CEWS that was merely a percentage of your Canadian payroll. While CEWS was advertised as a support for workers, it was really a blank cheque to companies.[17]
Aggressive tax avoidance is not the only reason corporations contribute little to public investment. Federal governments of all stripes have abetted this by continually cutting the corporate income tax rate over decades. Most provincial governments have also lowered corporate tax rates since the early 1990s.
Cuts to corporate income tax rates were justified with promises of greater private investment. That did not happen. The net investment rate—investment above replacement cost as a share of gross profit—of Canada’s most profitable publicly-traded companies has been falling since the mid-1980s.[18].
Most of the 37 companies have strongly favoured acquisitions over investment for years. Since 2015, they have spent two-and-a-half times more buying up other companies than they have on new investments. In 2020 and 2021, they spent three times more on consolidation. Twenty-one of the companies had negative net investment during the pandemic. That means many companies did not even fully replace the value of depreciated assets while buying their competitors, suppliers, or customers, thereby gaining greater control of their industries.
Tax-cut-fuelled acquisitions have led to increased corporation concentration and market power, rather than new and increased real investment. And now Canadians are suffering the consequences as companies hike prices and boost their profits without making job-creating investments.
Public costs, part 2: Corporate links to tax havens
Canada loses as much as $25 billion per year to corporate exploitation of tax havens, according to a 2019 report from the Parliamentary Budget Officer.[19] PBO researchers found that corporations claim a disproportionate amount of revenue in low tax jurisdictions, which is evidence of profit-shifting to avoid taxes. Tax havens often provide other advantages in addition to low tax rates, such as friendly courts, anonymity, and less regulatory oversight. While the mere fact of owning a subsidiary in a tax haven is not definitive proof of tax avoidance, such subsidiaries raise red flags.
Of the 37 companies that took CEWS, at least 30 have one or more subsidiaries in a tax haven jurisdiction. The most common location is the U.S. state of Delaware. Bermuda, Cayman Islands, and Luxembourg are the next most popular locations.
The runaway leader in identified tax haven subsidiaries is Brookfield Asset Management. Forty of its 685 wholly- and partially-owned subsidiaries are located in a tax haven. Many of Brookfield’s Canadian-registered subsidiaries are owned through companies registered in a tax haven. It is not obvious how the Canadian public benefits from allowing these ownership structures.
Brookfield Asset Management Inc deserves special attention among the 37 CEWS recipients.
- It had the largest tax gap in 2017-21.
- It has the most identified tax haven subsidiaries.
- It is tied for the most CEWS-receiving subsidiaries (with Suncor and Thomson-Reuters).
- Its acquisition of other companies greatly outpaces any other Canadian company.
Perhaps most importantly, five of its wholly-owned CEWS-receiving subsidiaries are owned through Bermuda.
Brookfield maintains an incredibly complicated web of interowning subsidiaries, which raises questions about why such a complicated—and costly—tangle of subsidiaries is necessary.
On December 9, 2022, Brookfield added to the complication by reorganizing itself into two publicly-traded companies: Brookfield Corporation and Brookfield Asset Management Ltd.
Summary/Policy recommendations: It’s time to redistribute excess profits and wealth
In sum, the pandemic years have been extremely good for some of Canada’s largest, most profitable corporations. Many enjoyed record profits and ultra-low tax rates while taking government support spending in the form of CEWS. Those same companies invested much less in productive capacity than they spent on greater consolidation. They also increased their total dividends and continued to spend tens of billions on share buybacks, worsening wealth disparity.
Federal financial support during the pandemic resulted in a large increase in the federal debt. CEWS was the single largest transfer of public funds into private hands in Canadian history.[20] However, while the government is going after Canadians that improperly received the Canada Emergency Response Benefit (CERB), or its replacement, the Canada Recovery Benefit (CRB), it has made no apparent effort to even account for how CEWS was used, let alone any effort to recover misbegotten funds.
Canada’s tax system should be updated to require corporations to contribute more of their profits into public investment. As corporations grow more valuable, so does the wealth of their owners. New tax measures are needed to direct a fairer share of corporate profits toward needed investment and reverse extreme wealth concentration. Wealth concentration hurts the economy while public investment improves it.
Excess profits or windfall profits tax: Canadian corporations are seeing record profit margins and paying tax at lower rates. An excess profits tax, sometimes called a windfall profits tax, would redistribute those extreme profits while reducing corporations’ incentives to increase profit margins. Many countries have already introduced windfall profits taxes on companies in specific sectors such as oil and gas. In the 2022 budget, the federal government introduced a temporary windfall tax on the financial sector. It should be expanded to include all sectors of the economy and apply to all companies experiencing extraordinary profit margins.
Minimum book profits tax: A minimum tax on companies’ book profits would circumvent some of the ways that large corporations avoid taxes. In 2023, the U.S. introduced a minimum tax on book profits for corporations with profits exceeding $1 billion. A similar tax in Canada would help close the gap between what corporations should pay and what they actually pay.
Raise the corporate tax rate: The 15% federal tax rate has not changed since 2008. Decades of lower tax rates have not resulted in economically beneficial investment and corporations have continued to find other means to lower their tax bill. Canada should raise the corporate tax rate to 20%.
Close tax loopholes for large corporations: The federal government should close tax loopholes, in particular the exclusion on capital gains, which allows corporations to pay less tax. Raising the inclusion rate for capital gains from 50% to at least 75% would make the tax system fairer and recover revenue.
End tax agreements with tax havens: International tax avoidance costs Canada billions annually. Canada’s tax agreements with known tax havens should be ended to prevent corporations from taking advantage of lower-tax jurisdictions and to ensure corporate profits are reinvested in Canada.
Improve corporate transparency: It should not take vigorous research to identify if Canadian corporations—particularly those receiving public funding—are avoiding tax. Greater tax transparency would enhance corporate accountability. Canada should follow the lead of Australia, which not only requires public reporting of corporate income and taxes for all medium and large corporations but is introducing publicly disclosed country-by-country reporting for multinationals to deter the use of tax havens and other loopholes for tax avoidance.
Recommendations for future business support programs
C4TF and others advocated for significant reforms to the CEWS program to ensure it would benefit workers rather than corporate bottom lines.[21]
While the government likely cannot recover the money distributed to profitable corporations and/or their subsidiaries, it can ensure that future public funds provided to businesses are allocated with greater effectiveness, transparency, and accountability.
limit wage support programs to small and medium sized employers, with support for large employers offered on a case-by-case basis.
- levels and duration of support should be publicly disclosed.
- include provisions to recover public funds from companies that misuse or misallocate the support.
- recipients of public funds should be restricted from providing bonuses to executives or increasing dividends to shareholders.
Finally, the government should investigate how CEWS funds were used. The unprecedented price tag on the program requires full transparency and accountability.
Summary of CEWS recipients
|
Company |
Has at least one identified tax haven subsidiary |
Paid out dividend |
Did share buyback |
Spent more on acquisitions than new investment |
Reduced total employment in 2020 |
Total employment in 2021 still below 2019 |
|
Alimentation Couche-Tard |
✔ |
✔ |
✔ |
✔ |
✔ |
✔ |
|
AltaGas |
✔ |
✔ |
✔ |
|
|
|
|
ARC Resources |
✔ |
✔ |
✔ |
✔ |
✔ |
|
|
Atco |
✔ |
✔ |
✔ |
|
✔ |
✔ |
|
BCE |
|
✔ |
✔ |
✔ |
✔ |
✔ |
|
Brookfield Asset Management |
✔ |
✔ |
✔ |
✔ |
|
|
|
Canadian National Railway |
✔ |
✔ |
✔ |
|
✔ |
✔ |
|
Canadian Natural Resources |
✔ |
✔ |
✔ |
|
✔ |
✔ |
|
Canadian Solar |
✔ |
|
✔ |
|
✔ |
|
|
Canfor |
|
|
✔ |
✔ |
|
|
|
CCL Industries |
✔ |
✔ |
|
✔ |
|
|
|
Cogeco Communications |
✔ |
✔ |
✔ |
✔ |
✔ |
|
|
Enbridge |
✔ |
✔ |
|
|
✔ |
✔ |
|
Fairfax Financial Holdings |
✔ |
✔ |
✔ |
|
✔ |
✔ |
|
Finning International |
✔ |
✔ |
✔ |
✔ |
✔ |
✔ |
|
Gildan Activewear |
✔ |
✔ |
✔ |
✔ |
✔ |
✔ |
|
Imperial Oil |
✔ |
✔ |
✔ |
✔ |
✔ |
✔ |
|
Intact Financial |
✔ |
✔ |
✔ |
✔ |
|
|
|
Interfor |
|
|
✔ |
✔ |
✔ |
|
|
Keyera |
✔ |
✔ |
|
|
✔ |
✔ |
|
Magna International |
✔ |
✔ |
✔ |
✔ |
✔ |
✔ |
|
Methanex |
✔ |
✔ |
✔ |
✔ |
NA |
NA |
|
Metro |
|
✔ |
✔ |
✔ |
|
|
|
National Bank of Canada |
✔ |
✔ |
✔ |
✔ |
|
|
|
Pembina Pipeline |
✔ |
✔ |
✔ |
|
✔ |
✔ |
|
Power Corp Of Canada |
✔ |
✔ |
✔ |
✔ |
✔ |
|
|
Quebecor |
|
✔ |
✔ |
✔ |
✔ |
✔ |
|
Rogers Communications |
|
✔ |
|
✔ |
✔ |
✔ |
|
Royal Bank of Canada |
✔ |
✔ |
✔ |
✔ |
|
|
|
Shaw Communications |
|
✔ |
✔ |
✔ |
NA |
NA |
|
Suncor Energy |
✔ |
✔ |
✔ |
✔ |
✔ |
|
|
TC Energy |
✔ |
✔ |
✔ |
|
✔ |
✔ |
|
TELUS |
✔ |
✔ |
|
✔ |
|
|
|
Thomson Reuters |
✔ |
✔ |
✔ |
✔ |
✔ |
|
|
Tourmaline Oil |
✔ |
✔ |
✔ |
|
|
|
|
Waste Connections |
✔ |
✔ |
✔ |
✔ |
|
|
|
West Fraser Timber |
✔ |
✔ |
✔ |
|
✔ |
|
Below we provide more detailed information on a representative selection of nine companies. They come from a range of industries, including finance, real estate, oil and gas, transportation, retail, information, and telecommunications. In addition to receiving CEWS, and having a total tax gap of $100 million or more in 2017-21, the companies all have at least one tax haven subsidiary and paid a dividend throughout the pandemic.
What is the tax gap? Canada’s corporate tax gap is the difference between how much tax a company would pay at the statutory tax rate and how much it actually paid. The tax gap results from three forms of tax avoidance: 1) the use of deductions and tax credits, 2) the use of sophisticated tax planning, 3) the evasion of taxes. Unfortunately, we do not know what portion of the tax gap derives from each form.
Brookfield Asset Management Inc.
Tax Gap: $6.5 billion
Brookfield Asset Management helms a sprawling enterprise that consists of at least 682 companies. Brookfield uses a complicated web of inter-ownership that obscures its actual stake in many subsidiaries. For example, according to the information contained in the Inter-corporate Ownership Database, Brookfield Asset Management ultimately owns 100% of Ember Resources Inc. However, ownership passes through 20 separate entities along seven tangled routes.
Despite this complicated web, we determined that Brookfield has at least six wholly-owned subsidiaries that collected CEWS plus sizable majority stakes in two additional CEWS recipients. Furthermore, ownership of five CEWS recipients passes entirely through a Bermuda-based subsidiary named Brookfield Infrastructure Partners LP.[22] Also, about 20% of Brookfield’s majority ownership in CWC Energy passes through three companies in the Cayman Islands, and another in Bermuda.
We identified a total of 40 Brookfield subsidiaries in tax havens. Nineteen are located in Bermuda, and 11 in Delaware, with the remainder in Luxembourg, Cayman Islands, and Barbados.
Many of the tax haven domiciled companies have Canadian subsidiaries. For example, Brookfield Renewable Energy Group Inc. and Brookfield Renewable Power Inc. are Canadian companies wholly owned by BRP Bermuda Limited. In fact, the Bermuda subsidiary consists of 149 wholly or majority owned subsidiaries, 141 of which are Canadian. BRP Bermuda is, in turn, held by a Canadian numbered company, which is further owned by three wholly-owned Delaware subsidiaries, including the confusingly named Brookfield Power Brazil US LLC.[23]
Brookfield has grown substantially over the last decade. Revenue in 2021 was almost double its pre-pandemic average (2015-9). The company’s shareholders reaped the rewards with capital gains of $67 billion plus dividends.
In 2021, Brookfield paid just 5.3% of its gross profit in tax while it sent 77.3% of gross profit to its shareholders and the owners of acquired companies. As part of its aggressive expansion, the company has made significant acquisitions since 2015. In 2021, Brookfield significantly increased its net investment. However, it still spent much more on consolidation through acquisition.
|
|
2005-9 (Avg) |
2010-4 (avg) |
2015-9 (avg) |
2020 |
2021 |
|
Market capitalization |
$16,290 |
$24,115 |
$52,415 |
$80,785 |
$125,345 |
|
Revenue |
$10,357 |
$18,283 |
$56,480 |
$82,321 |
$99,746 |
|
Operating cost |
$7,399 |
$13,496 |
$43,089 |
$61,397 |
$72,837 |
|
Gross profit |
$2,958 |
$4,787 |
$13,391 |
$20,924 |
$26,909 |
|
Taxes paid |
$115 |
$245 |
$661 |
$1,427 |
$1,412 |
|
Dividends |
$455 |
$685 |
$1,060 |
$1,123 |
$1,880 |
|
Share buybacks |
$199 |
$218 |
$376 |
$543 |
$466 |
|
Acquisitions |
$0 |
$0 |
$21,426 |
$4,474 |
$18,422 |
|
Net investment |
$4,431 |
$1,651 |
$3,188 |
$4,317 |
$14,842 |
|
Gross margin |
28.6% |
26.2% |
23.7% |
25.4% |
27.0% |
|
Tax rate |
3.9% |
5.1% |
4.9% |
6.8% |
5.2% |
|
Investment rate |
149.8% |
34.5% |
23.8% |
20.6% |
55.2% |
|
Distribution rate |
22.1% |
18.9% |
170.7% |
29.3% |
77.2% |
|
Employees (thousands) |
14.5 |
24.6 |
89.0 |
151.0 |
150.0 |
Note: All values in millions CAD$, unless otherwise indicated. Values for 2005-9, 2010-4, and 2015-9 are five-year averages. Market capitalization is for the last trading day of the calendar year. Market capitalization equals share price multiplied by common shares outstanding. Gross profits are earnings before taxes, interest, depreciation and amortization (EBITDA). Net investment is capital expenditure less depreciation and amortization. Gross margin is gross profit as a share of revenue. The tax rate is taxes paid as a share of gross profit. The investment rate is net investment as a share of gross profit. The distribution rate is dividends plus share buybacks plus acquisitions as a share of gross profit. Values for 2005-2019 are calculated using data from Compustat. Values for 2020 and 2021 come from financial disclosures via SEDAR. Values for market capitalization and employees in 2020 and 2021 come from YCharts.
Canadian Natural Resources Ltd.
Tax Gap: $6.1 billion
Canadian Natural Resources took CEWS, as did two of its wholly-owned subsidiaries, Painted Pony Energy Ltd and Storm Resources Ltd. While the company reported pre-tax losses in the first and second quarter of 2020, making it nominally eligible for CEWS, this was almost entirely due to depreciation and amortization. Tellingly, the company’s investment expenditures in those quarters did not even replace the claimed depreciation and amortization cost. The reported pre-tax losses in the first and second quarter also did not stop Canadian Natural from distributing a combined $1.2 billion in dividends and share buybacks in those quarters.
Canadian Natural has one identified subsidiary in a tax haven. The wholly-owned CanNat Energy Inc. is registered in Delaware.
The company greatly benefitted from the gain in oil and gas prices in 2021. Its gross profits more than doubled their pre-pandemic average, rising from $7.6 billion to $15.4 billion. In the same year, it actually claimed $62 million in net tax benefits. Shareholders were the biggest beneficiaries as Canadian Natural increased its total dividend payout by over 60%.
|
|
2005-9 |
2010-4 |
2015-9 |
2020 |
2021 |
|
Market capitalization |
$34,221 |
$39,957 |
$44,997 |
$36,210 |
$62,450
|
|
Revenue |
$10,763 |
$15,239 |
$16,687 |
$16,893 |
$30,057 |
|
Operating cost |
$4,038 |
$7,168 |
$9,118 |
$11,720 |
$14,422 |
|
Gross profit |
$6,725 |
$8,070 |
$7,569 |
$5,173 |
$15,635 |
|
Taxes paid |
$475 |
$521 |
-$195 |
-$29 |
-$62 |
|
Dividends |
$183 |
$558 |
$1,353 |
$1,950 |
$2,170 |
|
Share buybacks |
$15 |
$253 |
$445 |
$271 |
$1,581 |
|
Acquisitions |
$928 |
$0 |
$2,408 |
$0 |
$0 |
|
Net investment |
$3,298 |
$2,804 |
-$962 |
-$3,486 |
-$1,231 |
|
Gross margin |
62.5% |
53.0% |
45.4% |
30.6% |
52% |
|
Tax rate |
7.1% |
6.5% |
-2.6% |
-0.6% |
-0.4% |
|
Investment rate |
49.0% |
34.7% |
-12.7% |
-67.4% |
-7.9 |
|
Distribution rate |
16.7% |
10.0% |
55.6% |
42.9% |
24.0% |
|
Employees (thousands) |
3.6 |
6.0 |
8.9 |
10.2 |
10.0 |
Note: A company can have a negative tax rate if its tax benefits exceed its tax obligations. All values in millions CAD$, unless otherwise indicated. Values for 2005-9, 2010-4, and 2015-9 are five-year averages. Market capitalization is for the last trading day of the calendar year. Market capitalization equals share price multiplied by common shares outstanding. Gross profits are earnings before taxes, interest, depreciation and amortization (EBITDA). Net investment is capital expenditure less depreciation and amortization. Gross margin is gross profit as a share of revenue. The tax rate is taxes paid as a share of gross profit. The investment rate is net investment as a share of gross profit. The distribution rate is dividends plus share buybacks plus acquisitions as a share of gross profit. Values for 2005-2019 are calculated using data from Compustat. Values for 2020 and 2021 come from financial disclosures via SEDAR. Values for market capitalization and employees in 2020 and 2021 come from YCharts.
Enbridge Inc.
Tax Gap: $4.2 billion
Enbridge has one fully-owned CEWS recipient—NorthRiver Midstream, as well as minority claims on three more: Borealis Wind, Intelliview Technologies, and Syscor Controls & Automation.
Enbridge’s fully-owned subsidiary Spectra Energy Partners Canada Holding SARL is domiciled in the tax haven of Luxembourg. Three Canadian companies are nested within the Luxembourg company, culminating with Express Pipeline Inc. Express Pipeline owns the Canadian portion of the eponymous pipeline, which ships oil from Western Canada to the U.S.[24]
Enbridge has greatly increased its dividends over the last decade and a half. While company revenue has grown by an annualized 12% since 2005, dividends have increased by 22%. This has helped drive incredible growth in its market capitalization. Enbridge also spent an unprecedented $3.8 billion on acquisitions in 2021.
|
|
2005-9 |
2010-4 |
2015-9 |
2020 |
2021 |
|
Market capitalization |
$14,946 |
$35,104 |
$73,365 |
$82,480 |
$100,100 |
|
Revenue |
$11,923 |
$26,079 |
$41,836 |
$39,087 |
$47,071 |
|
Operating cost |
$10,083 |
$22,989 |
$33,398 |
$27,418 |
$35,414 |
|
Gross profit |
$1,840 |
$3,089 |
$8,438 |
$11,669 |
$11,657 |
|
Taxes paid |
$185 |
$91 |
$259 |
$524 |
$489 |
|
Dividends |
$459 |
$1,015 |
$4,210 |
$6,940 |
$7,133 |
|
Share buybacks |
$0 |
$0 |
$102 |
$0 |
$0 |
|
Acquisitions |
$38 |
$412 |
$14 |
$24 |
$3,785 |
|
Net investment |
$1,569 |
$4,625 |
$3,799 |
$1,693 |
$3,966 |
|
Gross margin |
15.4% |
11.8% |
20.2% |
29.9% |
24.8% |
|
Tax rate |
10.1% |
3.0% |
3.1% |
4.5% |
4.2% |
|
Investment rate |
85.2% |
149.7% |
45.0% |
14.5% |
34.0% |
|
Distribution rate |
27.0% |
46.2% |
51.3% |
59.7% |
93.7% |
|
Employees (thousands) |
5.9 |
7.7 |
10.5 |
11.3 |
11.2 |
Note: All values in millions CAD$, unless otherwise indicated. Values for 2005-9, 2010-4, and 2015-9 are five-year averages. Market capitalization is for the last trading day of the calendar year. Market capitalization equals share price multiplied by common shares outstanding. Gross profits are earnings before taxes, interest, depreciation and amortization (EBITDA). Net investment is capital expenditure less depreciation and amortization. Gross margin is gross profit as a share of revenue. The tax rate is taxes paid as a share of gross profit. The investment rate is net investment as a share of gross profit. The distribution rate is dividends plus share buybacks plus acquisitions as a share of gross profit. Values for 2005-2019 are calculated using data from Compustat. Values for 2020 and 2021 come from financial disclosures via SEDAR. Values for market capitalization and employees in 2020 and 2021 come from YCharts.
Canadian National Railway Co.
Tax Gap: $3.8 billion
CNR has one fully-owned CEWS recipient: Autoport Limited. It also has a minority stake in another: Alberta Prairie Steam Tours Ltd.
CNR has one identified fully-owned subsidiary in Delaware: Wisconsin Central Ltd. That subsidiary is the parent of two Canadian companies, WC Canada Holdings, Inc. and Algoma Central Railway Inc.
CNR has managed to steadily push down its tax rate from an average of 11.7% in 2005-9 to 10.7% in 2021. While only 10.7% of CNR’s gross profits went to tax in 2021, the company spent almost 60% of its gross profits on dividends, share buybacks, and consolidating acquisitions. CNR also reduced its net investment rate below its long-term average. After cutting employees in 2020, the company’s 2021 employment levels remained below its average in 2015-9.
|
|
2005-9 |
2010-4 |
2015-9 |
2020 |
2021 |
|
Market capitalization |
$24,252 |
$43,936 |
$72,745 |
$99,400 |
$108,900 |
|
Revenue |
$7,740 |
$9,991 |
$13,385 |
$13,819 |
$14,477 |
|
Operating cost |
$4,271 |
$5,356 |
$6,623 |
$6,967 |
$7,400 |
|
Gross profit |
$3,470 |
$4,635 |
$6,762 |
$6,852 |
$7,077 |
|
Taxes paid |
$406 |
$519 |
$738 |
$353 |
$759 |
|
Dividends |
$389 |
$656 |
$1,254 |
$1,634 |
$1,740 |
|
Share buybacks |
$1,101 |
$1,328 |
$1,994 |
$402 |
$1,635 |
|
Acquisitions |
$106 |
$0 |
$52 |
$0 |
$908 |
|
Net investment |
$644 |
$908 |
$1,783 |
$1,274 |
$1,293 |
|
Gross margin |
44.8% |
46.4% |
50.5% |
49.6% |
48.9% |
|
Tax rate |
11.7% |
11.2% |
10.9% |
5.2% |
10.7% |
|
Investment rate |
18.6% |
19.6% |
26.4% |
18.6% |
18.3% |
|
Distribution rate |
46.0% |
42.8% |
48.8% |
29.7% |
60.5% |
|
Employees (thousands) |
22.0 |
23.6 |
24.2 |
21.9 |
23.8 |
Note: All values in millions CAD$, unless otherwise indicated. Values for 2005-9, 2010-4, and 2015-9 are five-year averages. Market capitalization is for the last trading day of the calendar year. Market capitalization equals share price multiplied by common shares outstanding. Gross profits are earnings before taxes, interest, depreciation and amortization (EBITDA). Net investment is capital expenditure less depreciation and amortization. Gross margin is gross profit as a share of revenue. The tax rate is taxes paid as a share of gross profit. The investment rate is net investment as a share of gross profit. The distribution rate is dividends plus share buybacks plus acquisitions as a share of gross profit. Values for 2005-2019 are calculated using data from Compustat. Values for 2020 and 2021 come from financial disclosures via SEDAR. Values for market capitalization and employees in 2020 and 2021 come from YCharts.
Alimentation Couche-Tard Inc.
Tax Gap: $2.5 billion
Alimentation Couche-Tard Inc. has two identified CEWS recipients, one of which bears the name Couche-Tard Inc. The other is Mac’s Convenience Stores Inc. However, many of Alimentation Couche-Tard’s franchisees also received CEWS. There were 17 recipients operating under the Mac’s Convenience Store name and 16 recipients operating under the Circle K banner.
Alimentation Couche-Tard has one subsidiary in a tax haven. Couche-Tard U.S. LP resides in Delaware.
Notably, the grocery chain Metro Inc. owns 17% of Alimentation Couche-Tard.
The company has seen significant growth in its gross profit margin, rising from an average of 3.8% in 2005-9 to 8% in 2021. This growth in profits has funded more distribution to shareholders. In 2020, Alimentation Couche-Tard spent more on share buybacks than it had over the previous 15 years combined. At the same time, its investment spending was below replacement costs. In 2021, the company spent over $2.3 billion on share buybacks on top of the $418 million it paid in dividends while its investment spending remained below replacement costs.
In 2019, Couche-Tard had approximately 131,000 employees. In 2020, despite receiving the CEWS subsidy, it reduced its total employees to 124,000. It made further cuts to 122,000 in 2021.
|
|
2005-9 |
2010-4 |
2015-9 |
2020 |
2021 |
|
Market capitalization |
$3,998 |
$18,528 |
$38,074 |
$48,410 |
$56,290 |
|
Revenue |
$15,147 |
$31,989 |
$63,034 |
$59,290 |
$79,476 |
|
Operating cost |
$14,574 |
$30,610 |
$58,853 |
$52,844 |
$72,998 |
|
Gross profit |
$573 |
$1,380 |
$4,181 |
$6,435 |
$6,478 |
|
Taxes paid |
$78 |
$176 |
$402 |
$868 |
$904 |
|
Dividends |
$20 |
$62 |
$216 |
$348 |
$418 |
|
Share buybacks |
$56 |
$53 |
$180 |
$1,356 |
$2,331 |
|
Acquisitions |
$219 |
$875 |
$1,886 |
$562 |
$409 |
|
Net investment |
$126 |
$25 |
$275 |
-$772 |
$-354 |
|
Gross margin |
3.8% |
4.3% |
6.6% |
10.9% |
8.2% |
|
Tax rate |
13.7% |
12.7% |
9.6% |
13.5% |
14.0% |
|
Investment rate |
22.0% |
1.8% |
6.6% |
-12.0% |
-5.5% |
|
Distribution rate |
51.4% |
71.8% |
54.6% |
35.2% |
48.8% |
|
Employees (thousands) |
45.6 |
73.7 |
120.8 |
124.0 |
122.0 |
Note: Couche-Tard’s fiscal year ends in April. The company identifies the fiscal year with the ending year while we are identifying it with the starting year. For example, the fiscal year ending April 24, 2022 is identified by Couche-Tard as the 2022 fiscal year. However, we are labelling it 2021 as that year contained most of the financial fiscal year’s financial activity. Couche-Tard includes impairment in its reported depreciation and amortization. All values in millions CAD$, unless otherwise indicated. Values for 2005-9, 2010-4, and 2015-9 are five-year averages. Market capitalization is for the last trading day of the calendar year. Market capitalization equals share price multiplied by common shares outstanding. Gross profits are earnings before taxes, interest, depreciation and amortization (EBITDA). Net investment is capital expenditure less depreciation and amortization. Gross margin is gross profit as a share of revenue. The tax rate is taxes paid as a share of gross profit. The investment rate is net investment as a share of gross profit. The distribution rate is dividends plus share buybacks plus acquisitions as a share of gross profit. Values for 2005-2019 are calculated using data from Compustat. Values for 2020 and 2021 come from financial disclosures via SEDAR. Values for market capitalization and employees in 2020 and 2021 come from YCharts.
Fairfax Financial Holdings Limited
Tax Gap: $2.3 billion
Fairfax Financial Holdings Limited had majority ownership of Recipe Unlimited Corp. when the latter collected CEWS. That ownership was split among 11 different wholly-owned subsidiaries, including three in Delaware. Fairfax has since reduced its ownership stake to 17%, but that stake flows through one of the Delaware subsidiaries, Odyssey Re Holdings Corp.
Fairfax retains a large majority stake in another CEWS recipient named Brainhunter Systems Ltd.
In addition to Odyssey Re Holdings, Fairfax has at least seven more wholly-owned tax haven subsidiaries. These are found in Singapore, Switzerland, Barbados, and the Netherlands, in addition to Delaware.
Although Fairfax almost tripled its gross profit margin in 2021 compared to its pre-pandemic average (2015-9), and spent over $1.5 billion on share buybacks, it actually saw a fall in its market capitalization.
|
|
2005-9 |
2010-4 |
2015-9 |
2020 |
2021 |
|
Market capitalization |
$5,390 |
$9,298 |
$16,135 |
$11,700 |
$15,350 |
|
Revenue |
$7,785 |
$7,864 |
$18,870 |
$25,496 |
$33,157 |
|
Operating cost |
$6,173 |
$7,069 |
$17,397 |
$24,715 |
$27,283 |
|
Gross profit |
$1,612 |
$795 |
$1,473 |
$781 |
$5,874 |
|
Taxes paid |
$291 |
$41 |
$261 |
$82 |
$365 |
|
Dividends |
$84 |
$272 |
$391 |
$414 |
$401 |
|
Share buybacks |
$146 |
$38 |
$249 |
$309 |
$1,507 |
|
Acquisitions |
$359 |
$116 |
$988 |
$0 |
-$1,594 |
|
Net investment |
-$3 |
-$23 |
-$50 |
-$620 |
-$729 |
|
Gross margin |
20.7% |
10.1% |
7.8% |
3.1% |
17.7% |
|
Tax rate |
18.0% |
5.2% |
17.7% |
10.5% |
6.2% |
|
Investment rate |
-0.2% |
-2.9% |
-3.4% |
-79.4% |
-12.4% |
|
Distribution rate |
36.5% |
53.5% |
110.6% |
92.6% |
5.3% |
|
Employees (thousands) |
6.3 |
9.7 |
35.2 |
41.0 |
39.0 |
Note: Fairfax appears to have recorded net negative acquisitions for 2021 because the cash acquired exceeded the recorded cost on the purchase. This significantly reduced its distribution rate in 2021. All values in millions CAD$, unless otherwise indicated. Values for 2005-9, 2010-4, and 2015-9 are five-year averages. Market capitalization is for the last trading day of the calendar year. Market capitalization equals share price multiplied by common shares outstanding. Gross profits are earnings before taxes, interest, depreciation and amortization (EBITDA). Net investment is capital expenditure less depreciation and amortization. Gross margin is gross profit as a share of revenue. The tax rate is taxes paid as a share of gross profit. The investment rate is net investment as a share of gross profit. The distribution rate is dividends plus share buybacks plus acquisitions as a share of gross profit. Values for 2005-2019 are calculated using data from Compustat. Values for 2020 and 2021 come from financial disclosures via SEDAR. Values for market capitalization and employees in 2020 and 2021 come from YCharts.
Suncor Energy Inc.
Tax Gap: $1.1 billion
Suncor Energy Inc. claimed CEWS, as did at least six of its fully-owned subsidiaries. Suncor also owns a majority share of Syncrude, which also collected CEWS. The company has minority stakes in five additional CEWS recipients: Sydco Fuels Ltd, Les Petroles Sherbrooke Inc, Les Huiles Desroches Inc, Montreal Pipe Line Ltd, and Hibernia Management and Development Company Ltd.
Suncor owns at least one identified tax haven subsidiary: Suncor Energy (Cyprus) Limited.
In 2021, Suncor’s taxes paid were negative despite a gross profit margin above its historical average. Negative taxes provide a benefit that can be used against future tax obligations. Suncor’s net investment has been negative for the past four years. Despite receiving CEWS, Suncor reduced its employment in 2020.
|
|
2005-9 |
2010-4 |
2015-9 |
2020 |
2021 |
|
Market capitalization |
$41,189 |
$52,776 |
$65,243 |
$32,560 |
$45,620 |
|
Revenue |
$19,701 |
$38,580 |
$32,990 |
$24,662 |
$39,132 |
|
Operating cost |
$15,985 |
$28,011 |
$23,064 |
$20,643 |
$26,683 |
|
Gross profit |
$3,716 |
$10,568 |
$9,926 |
$4,019 |
$12,449 |
|
Taxes paid |
$355 |
$1,525 |
$700 |
$695 |
-$532 |
|
Dividends |
$194 |
$923 |
$2,119 |
$1,670 |
$1,550 |
|
Share buybacks |
$0 |
$1,059 |
$1,357 |
$307 |
$2,304 |
|
Acquisitions |
-$37 |
$296 |
$561 |
$113 |
$28 |
|
Net investment |
$3,623 |
$1,445 |
-$1,203 |
-$5,600 |
-$1,295 |
|
Gross margin |
18.9% |
27.4% |
30.1% |
16.3% |
31.8% |
|
Tax rate |
9.6% |
14.4% |
7.0% |
17.3% |
-4.3% |
|
Investment rate |
97.5% |
13.7% |
-12.1% |
-139.3% |
-10.4% |
|
Distribution rate |
4.2% |
21.6% |
40.7% |
49.9% |
31.9% |
|
Employees (thousands) |
7.4 |
13.4 |
12.8 |
12.6 |
16.9 |
Note: All values in millions CAD$, unless otherwise indicated. Values for 2005-9, 2010-4, and 2015-9 are five-year averages. Market capitalization is for the last trading day of the calendar year. Market capitalization equals share price multiplied by common shares outstanding. Gross profits are earnings before taxes, interest, depreciation and amortization (EBITDA). Net investment is capital expenditure less depreciation and amortization. Gross margin is gross profit as a share of revenue. The tax rate is taxes paid as a share of gross profit. The investment rate is net investment as a share of gross profit. The distribution rate is dividends plus share buybacks plus acquisitions as a share of gross profit. Values for 2005-2019 are calculated using data from Compustat. Values for 2020 and 2021 come from financial disclosures via SEDAR. Values for market capitalization and employees in 2020 and 2021 come from YCharts.
Thomson Reuters Corporation
Tax Gap: $986 million
More than 90% of the Thomson Reuters Corporation is owned by Canada’s richest family via The Thomson Family Group. Ownership passes through a complex web of inter-owning subsidiaries.
The table below shows one part of this complicated set of holding companies through which The Thomson Family Group owns Thomson Reuters Corporation.
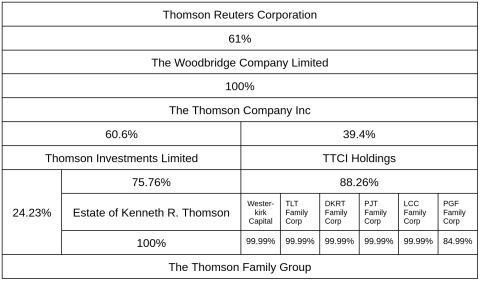
Note: Percentages are the share of the top company held by the lower company. Based on data from the Inter-corporate Ownership Database.
The table is greatly simplified by excluding all of the companies between The Thomson Family Group and the six subsidiaries that hold a combined 88.3% of TTCI Holdings. A portion of all six passes through Thomson Investments Limited. In total, The Thomson Family Group holdings of Thomson Reuters pass along 62 paths through 21 identified separate entities.
The Thomson Family Group owns 94.7% or more of 11 CEWS recipients, including the Globe & Mail. It has a minority stake in two more companies that received CEWS, including the Canadian Press.
There are three identified tax haven subsidiaries among the companies held by the Thomson Family. Two tax haven subsidiaries are fully owned by Thomson Reuters Corporation: Thomson Reuters Finance SA and Thomson Reuters Holdings SA, both domiciled in Luxembourg.
Thomson Reuters’ market capitalization has increased by more than $33 billion compared to its pre-pandemic average, despite lower revenue and gross profit, perhaps in response to a higher gross profit margin.
Thomson Reuters has not made positive net investment since at least 2005, meaning the company is not even spending enough to replace the depreciation of its assets. It reduced its total dividend payout in 2019 after buying back $13.6 billion in shares the year before. However, dividend payments increased in 2020 and again in 2021.
|
|
2005-9 |
2010-4 |
2015-9 |
2020 |
2021 |
|
Market capitalization |
$28,065 |
$29,543 |
$40,153 |
$51,790 |
$73,530 |
|
Revenue |
$10,604 |
$13,696 |
$12,248 |
$7,753 |
$8,032 |
|
Operating cost |
$7,541 |
$9,929 |
$8,907 |
$5,181 |
$5,530 |
|
Gross profit |
$3,063 |
$3,767 |
$3,341 |
$3,526 |
$2,546 |
|
Taxes paid |
$329 |
$372 |
$352 |
$212 |
$1,349 |
|
Dividends |
$768 |
$1,094 |
$1,253 |
$978 |
$1,011 |
|
Share buybacks |
$317 |
$422 |
$3,937 |
$259 |
$1,771 |
|
Acquisitions |
$2,491 |
$946 |
$476 |
$216 |
$23 |
|
Net investment |
-$322 |
-$756 |
-$556 |
-$373 |
-$358 |
|
Gross margin |
28.9% |
27.5% |
27.3% |
45.5% |
31.7% |
|
Tax rate |
10.7% |
9.9% |
10.5% |
6.0% |
53.0% |
|
Investment rate |
-10.5% |
-20.1% |
-16.6% |
-10.6% |
-14.1% |
|
Distribution rate |
116.8% |
65.4% |
169.6% |
41.2% |
110.2% |
|
Employees (thousands) |
47.0 |
57.7 |
38.8 |
24.0 |
24.4 |
Note: Thomson-Reuters taxes paid and tax rate increased dramatically in 2021 due to the payment of previously deferred taxes for discontinued operations. All values in millions CAD$, unless otherwise indicated. Values for 2005-9, 2010-4, and 2015-9 are five-year averages. Market capitalization is for the last trading day of the calendar year. Market capitalization equals share price multiplied by common shares outstanding. Gross profits are earnings before taxes, interest, depreciation and amortization (EBITDA). Net investment is capital expenditure less depreciation and amortization. Gross margin is gross profit as a share of revenue. The tax rate is taxes paid as a share of gross profit. The investment rate is net investment as a share of gross profit. The distribution rate is dividends plus share buybacks plus acquisitions as a share of gross profit. Values for 2005-2019 are calculated using data from Compustat. Values for 2020 and 2021 come from financial disclosures via SEDAR. Values for market capitalization and employees in 2020 and 2021 come from YCharts.
Telus Corp
Tax Gap: $704 million
Telus Corporation has four fully-owned CEWS recipients: Telus Health Solutions Inc, Telus Health & Payment Solutions GP Inc, Telus Retail Limited, and Mobile Service Center Canada Limited.
The company has one identified subsidiary in a tax haven: Telus JV Inc, which is registered in Delaware. However, Telus is also the majority owner of Telus International (Cda) Inc, which had three identified tax haven subsidiaries as of 2021.[25]
Telus almost tripled its acquisitions in 2020 from the year prior, which was already significantly higher than any previous year. The company also increased its dividend in 2020, while its net investment turned negative and stayed negative in 2021. Telus’ spending on acquisitions and increased dividend pushed its distribution rate to 83.9%.
|
|
2005-9 |
2010-4 |
2015-9 |
2020 |
2021 |
|
Market capitalization |
$14,197 |
$20,216 |
$26,764 |
$32,560 |
$40,820 |
|
Revenue |
$9,031 |
$10,844 |
$13,408 |
$15,463 |
$17,258 |
|
Operating cost |
$5,404 |
$6,921 |
$8,489 |
$9,969 |
$10,968 |
|
Gross profit |
$3,627 |
$3,923 |
$4,919 |
$5,494 |
$6,290 |
|
Taxes paid |
-$3 |
$303 |
$378 |
$430 |
$601 |
|
Dividends |
$486 |
$790 |
$1,176 |
$1520 |
$1,711 |
|
Share buybacks |
$544 |
$322 |
$181 |
$0 |
$0 |
|
Acquisitions |
$160 |
$73 |
$410 |
$3,205 |
$468 |
|
Net investment |
$85 |
$6 |
$201 |
-$190 |
-$119 |
|
Gross margin |
40.2% |
36.2% |
36.7% |
35.5% |
36.4% |
|
Tax rate |
-0.1% |
7.7% |
7.7% |
7.8% |
9.6% |
|
Investment rate |
2.3% |
0.1% |
4.1% |
-3.5% |
-1.9% |
|
Distribution rate |
32.8% |
30.2% |
35.9% |
86.0% |
34.6% |
|
Employees (thousands) |
33.8 |
41.1 |
55.2 |
78.1 |
90.8 |
Note: All values in millions CAD$, unless otherwise indicated. Values for 2005-9, 2010-4, and 2015-9 are five-year averages. Market capitalization is for the last trading day of the calendar year. Market capitalization equals share price multiplied by common shares outstanding. Gross profits are earnings before taxes, interest, depreciation and amortization (EBITDA). Net investment is capital expenditure less depreciation and amortization. Gross margin is gross profit as a share of revenue. The tax rate is taxes paid as a share of gross profit. The investment rate is net investment as a share of gross profit. The distribution rate is dividends plus share buybacks plus acquisitions as a share of gross profit. Values for 2005-2019 are calculated using data from Compustat. Values for 2020 and 2021 come from financial disclosures via SEDAR. Values for market capitalization and employees in 2020 and 2021 come from YCharts.
Endnotes
[1] Journalists have identified and compiled some of the amounts collected by specific companies. See Patrick Brethour, Tom Cardoso, David Milstead, and Vanmala Subramaniam. “Wage subsidies were meant to preserve jobs. In many cases, the $110.6 billion response padded bottom lines.” Globe & Mail, May 8, 2021, https://www.theglobeandmail.com/business/article-canada-emergency-wage-subsidy-data-analysis/; Victor Ferreira and Kevin Carmichael. “As CEWS flowed in, dividends flowed out.” Financial Post, December 7, 2020, https://financialpost.com/investing/fp-investigation-as-cews-flowed-in-dividends-flowed-out.
[2] The conditions for receiving CEWS were tied to declines in revenue with no requirement that employees actually be kept on the payroll. Details can be found on the Government of Canada’s archived FAQ about the program, https://www.canada.ca/en/revenue-agency/services/wage-rent-subsidies/ce…)
[3] Corporate disclosures rarely identify country-by-country employment, so we cannot determine where employment reduction occurred.
[4] The 74 companies examined were among the 123 that were analyzed to measure the corporate tax gap. All these were large corporations with a market capitalization of $2 billion or more at the end of 2021.
[5] Information on subsidiaries comes from Inter-corporate Ownership (https://www150.statcan.gc.ca/n1/en/catalogue/61-517-X) augmented with information included in corporate disclosures, particularly Annual Information Forms. Subsidiary names were matched to names found in the CEWS Registry (https://apps.cra-arc.gc.ca/ebci/habs/cews/srch/pub/fllLstSrh). A similar analysis was performed by Michael Smart and Nick Mahoney for Finances of the Nation, https://financesofthenation.ca/2020/12/29/large-corporate-groups-that-received-cews-payments-in-2020/. Errors within either database, including missing entries, as well as name variations, could limit the completeness of the results. Financial information came from the Compustat database, as well as corporate disclosures, which were accessed via SEDAR (https://www.sedar.com/), and YCharts.
[6] We define a company as ‘directly’ receiving CEWS if: 1) the company received CEWS, or 2) one of its majority-owned subsidiaries received CEWS, or 3) the company’s majority-owning parent company has a majority-owned subsidiary that received CEWS.
[7] We defined a company as ‘indirectly’ benefiting if a minority-owned subsidiary received CEWS.
[8] Tax haven jurisdictions are those identified in our 2017 report Bay Street and Tax Havens: Curbing Corporate Canada’s Addiction: https://www.taxfairness.ca/en/resources/reports/report-bay-street-and-tax-havens.
[9] Some companies do not report total employment data.
[10] Share buybacks and acquisitions do not distribute money to a company’s own shareholders. In the case of share buybacks, the sellers are exchanging their shares for money. In the case of acquisitions, it is the owners of the acquired company that receive the money. However, both transfer money from the company into accounts of the shareholding class. Share buybacks will increase the equity valuation of a company, which does benefit its own shareholders. Acquisitions have an uncertain effect on valuation, depending on how shareholders react. Equity ownership is highly concentrated. The wealthiest 10% of Canadians own over 80% of all business equity. The bottom half hold barely 1%. Statistics Canada. Table 11-10-0075-01 Selected assets and debts by net worth deciles, Survey of Financial Security.
[11] New investment is calculated as capital expenditure less depreciation and amortization.
[12] Gildan Activewear Inc suspended its dividend and share buybacks in 2020Q1, resumed them in 2020Q2, but suspended them again in 2020Q3 through 2021Q1. https://www.globenewswire.com/en/news-release/2020/04/29/2024615/0/en/Gildan-Activewear-Reports-First-Quarter-2020-Results.html
[13] David Macdonald and Alicia Massie, 2021, Boundless Bonuses: Skyrocketing Canadian executive pay during the 2020 pandemic (https://policyalternatives.ca/BoundlessBonuses).
[14] This analysis is based on the 100 largest Canadian-headquartered publicly-traded companies for each year.
[15] Acquisition spending is highly variable, in part due to especially large one-off acquisitions. For example, acquisitions by the 37 CEWS recipients hit an all-time high of $94 billion in 2016, with TC Energy’s $13.6 billion acquisition of Columbia Pipeline Group making up 14% of the combined spending. The next year, acquisitions fell to $72.8 billion.
[16] This figure is for worldwide employment. Unfortunately, most companies do not report detailed country-by-country employment figures.
[17] C4TF called attention to the overly lax conditions when the program was introduced. See Toby Sanger, “Making the COVID19 Wage Subsidy Program work better for workers”, Progressive Economics Forum (https://www.progressive-economics.ca/2020/03/making-the-covid19-wage-su…).
[18] This is based on analysis of the 100 most profitable Canadian companies for each year since 1980.
[19] Parliamentary Budget Office. 2019. Preliminary Findings on International Taxation. https://www.pbo-dpb.ca/en/publications/RP-1920-020--preliminary-finding…
[20] Brethour, Cardoso, Milstead, and Subramaniam, op. cit.
[21] Sanger, op. cit.
[22] Huron Central Railway Inc., Railcare Inc., Western labrador Rail Services Inc., Cape Breton & Central Nova Scotia Railway Limited
[23] Mountnote LLC, and Brookfield Renewable Power Holdings LLC are the other two Delaware based parents.
[24] Canada Energy Regulator, Pipeline Profiles: Express Pipeline (https://www.cer-rec.gc.ca/en/data-analysis/facilities-we-regulate/pipel…)
[25] Information on the subsidiaries of Telus International (Cda) Inc comes from its 2021 prospectus.
