Summary
Summary of the report highlights (PDF)
Report
The Path to A Green Economy
For as long as the federal government has given its attention to climate change, it has used the tax system to try and incentivize emission reduction and clean production by Canada’s private sector. At the same time, the tax system continues to be used to subsidize the largest source of emissions: the fossil fuel sector. With the 2023 federal budget, the Canadian government offered the most ambitious federal investment in climate action to date, largely through the tax system. The government explicitly stated that “Canada has taken a market-driven approach to emissions reduction”.[i]Given the scope, scale, and uncertainty of the climate crisis, enticing the private sector through tax credits is likely to be insufficient, and as currently structured, exacerbate economic inequalities. To meet the challenge in a way that is just, the Canadian government will need to provide more direct investment and commit our public sector to a leadership role in economic transformation. This will require a more thoughtful approach to taxation.
Canada is currently committed to cutting emissions 40-45% below 2005 levels by 2030 and achieving net-zero by 2050.[ii] Canada’s commitment is an essential part of a global objective to stop catastrophic economic, social, and environmental costs. Failure to act will bring significant costs to the well-being of Canadians. A conservative estimate of the more predictable costs of climate change forecasts a $100 billion annual reduction in Canada’s national income by 2055.[iii] While the cost of accomplishing our climate goals, and mitigating the harms caused by the climate crisis, remains uncertain, all estimates fall well below the cost of inaction.
There have been many estimates of how much the appropriate scale of climate action will cost. In order to understand the scale of necessary spending, we have drawn on several recent analyses, which come from the Canadian Centre for Policy Alternatives (CCPA), Climate Action Network Canada (CAN-Rac), the Green Budget Coalition, and the Royal Bank.[4] From these analyses, we estimate that $150 - $350 billion in public spending will be needed over the next five years. This will cover investments in clean electricity generation, improved home and building energy efficiency, support for Indigenous-led climate initiatives, and more.
These numbers are significant. However, they need to be put in perspective. Figure 1 shows annual federal spending from 1929 through 2022 and projected spending for 2023-7, plus the additional spending that would be required for the high-end of our estimate.
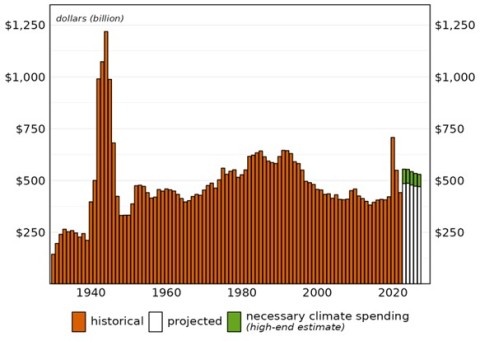
Figure 1: Spending What It Takes: Federal spending, 1929-2027[5]
In context, the annual spending demands are actually quite modest. When added to the federal government’s current spending projections, the annual amount is well below what was spent during the first year of the COVID-19 pandemic, and far less than what was spent fighting World War II. It is even less than total annual expenditures from 1982-1995, when lenders pocketed over a hundred billion dollars each year in interest payments.
The wide range of estimates for necessary government spending partially stems from differences over the relative roles of the public and private sectors. The CCPA/CAN-Rac and Green Budget Coalition figures are entirely focused on public spending. The RBC estimates include spending it assigns to the private sector and families.[6] Disagreements over how spending ought to be allocated between public and private sectors is a key source of tension over whether or not the federal government is doing enough. Private sector involvement will be essential, but Canada’s public sector needs to take a leadership role in a “mission-based” approach to economic transformation.[7] Targeted public investment, such as in zero emission public transit or transforming public infrastructure, can create more stability and certainty for private sector involvement while guiding a more equitable and effective transition toward a sustainable economy.
The federal government’s current climate action spending expresses its expectation that, with the proper incentives, the private sector will assume the bulk of the cost.[8] In order to achieve this, it is largely relying on market-oriented mechanisms, like carbon prices and tax credits. Given the severity of the climate crisis, and the extreme economic uncertainty it is causing, the assumption that nudges to the market will be sufficient is risky. Further, market outcomes are highly unequal. An approach overly focused on markets is likely to exacerbate problems of poverty and extreme wealth concentration.
The pandemic demonstrated that government spending has an unparalleled role to play supporting Canadians when the private sector cannot or will not (see Box 1: ‘Money-creation & fiscal management’). In the case of funding a just transition, the expenditures should largely take the role of investments that create valuable, publicly-owned assets, such as environmentally sustainable public housing.[9] Ultimately, all climate spending will need to be thoughtfully managed to prevent deleterious impacts like waste, high inflation or worsening income and wealth inequality. Canada needs to transform its tax system to ensure its climate action creates a just transition to a green economy.
Absent the appropriate tax measures, public dollars spent into the economy have a habit of concentrating in the hands of those who are already the wealthiest members of society (see Box 2: ‘Government spending & corporate profits’). As we will discuss, these are the same people who have disproportionately benefited from historical carbon emissions. They are also the people best equipped to weather the challenges caused by the climate crisis.
The tax system has many roles to play in climate action, including: providing incentives for positive behaviour and disincentives for negative behaviour; raising funds for public investment; and, fairly distributing the cost of the transition. All these roles need to be considered as we deal with the effects of the climate crisis, transition to a green economy, and confront the realities of inequality.
The Role of Taxes
In 1966, the Royal Commission on Taxation—widely known as the Carter Commission—published a comprehensive report advocating significant reforms to make Canada’s tax system more fair.[10] While climate change was obviously not on the radar of the Carter Commission when it undertook its study, inequality was. The Commission identified equity as the abiding and overriding principle for a tax system, with efficiency and effectiveness as two additional, broad principles. Equity was understood by the commissioners in terms of “economic power”.[11] They believed the tax system should be highly progressive as a way to ensure that those with the greatest economic power contributed the greatest share to government revenue.
Our understanding of the role of taxes has evolved since the days of the Carter Commission. Yet, their insight in terms of economic power feels prescient and can help us understand the role of taxes in our climate efforts.
We can think about a tax system serving three general roles in the Canadian economy:
- To provide revenue for government operations and public investment.
- To redistribute economic power more equitably
- To regulate economic behaviour in alignment with social objectives.[12]
Each of these roles is important, and each role is relevant to climate action. This relevance will be briefly explained and then developed more fully in later sections.
As governments collect and spend revenue, they generate economic activity. Government spending can bolster certain parts of the economy deemed beneficial to a society’s goals—such as healthcare. Government investment in a particular area or sector will often attract private investment, triggering further economic activity.[13] Governments need revenue tools as part of responsible fiscal management and taxes are the primary form of revenue. This role remains relevant even for governments that can create money to spend (see Box 1).
Under our current economic structure, it is also the case that, as publicly spent funds circulate through the economy, they tend to end up siphoned into corporate profit and/or pools of highly concentrated personal wealth (see Box 2). This dynamic was made clear during the pandemic. Significant government spending—$240 billion in the first six months—supported individual Canadians in important ways.[14] It helped to lift over one million people out of poverty in a single year, the largest reduction on record.[15] However, it also contributed to Canadian corporations increasing their annual profits by $196 million in 2021 and $275 billion in 2022.[16] Over those two years, the 100 largest publicly-listed corporations distributed $124 billion more to shareholders than in 2018 and 2019.[17] Having a progressive tax system allows us to reclaim some of those public dollars—and the economic power that comes with them—in order to redistribute it through government programs, supports, and investments.
While the federal income tax structure has remained generally progressive since the Carter Commission—despite many attacks and steps backward—it has failed to keep up with the growth of market income inequality. In the early-1980s, the bottom half of income earners got around 14% of total market income. This was almost double the share going to the Top 1%. By 1995, the 1% were receiving a larger share than the bottom half. This remains the case for market distribution (Figure 2).
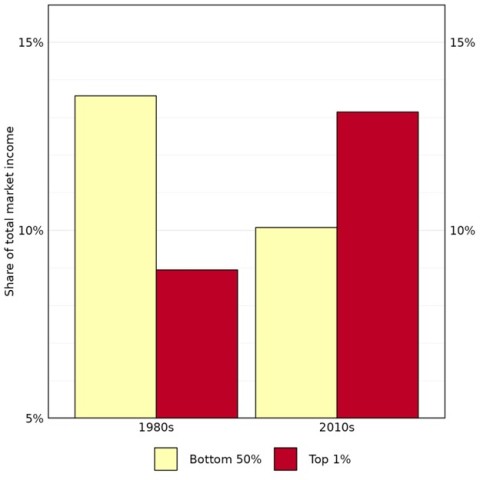
Figure 2: Income shares, 1980s vs. 2010s[18]
Wealth inequality is even more skewed than income inequality. A common measure of inequality is the T10/B50 ratio, which divides the per capita income (or wealth) of the Top 10% by the per capita value for the Bottom 50%. Figure 3 compares Canada’s income and wealth inequality in 2019. On average, the Top 10% of income earners collected 12.2 times the income of the Bottom 50%. However, the top decile of wealth holders have over 60 times the wealth of those in the bottom half (Figure 3).[19]
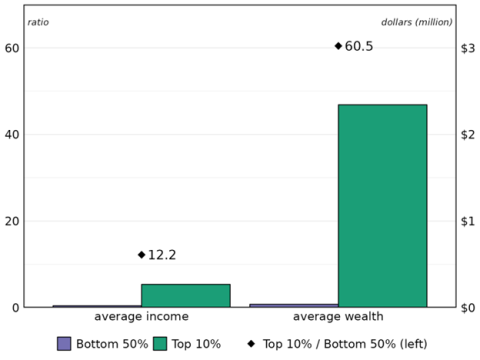
Figure 3: Income and wealth inequality in Canada, 2021[20]
As the members of the Carter Commission emphasized, it is essential that taxes are progressive. A progressive tax system redistributes economic power, reducing the gap between those at the bottom of the economic hierarchy and those at the top. As market distribution has gotten worse, a progressive income tax has become even more important. Unfortunately, as evidenced by Canada’s wealth disparity, our tax system has failed to properly redistribute economic power. In addition to having more economic power, research discussed below shows that those at the top contribute an outsized share of emissions. This fact compounds the reasoning behind the Carter Commission’s commitment to progressive taxation.
The idea that behavioural incentives and disincentives can be effectively placed on the market through tax breaks or additional taxes respectively is uncertain and contentious.[21] Firstly, actual economies are more complex than even the most sophisticated models, with sometimes unpredictable macro and micro social forces affecting market behavior and overwhelming the expected impact of tax tools. Further, individuals can be skeptical of, and resistant to, governments trying to affect their behaviour through taxation.[22] Nonetheless, governments around the world, including Canada, are employing various forms of carbon taxes and green tax credits to achieve reductions across a broad range of sectors in the economy. While individuals and households can be difficult to model, for-profit enterprises are designed to respond more predictably to financial (dis)incentives, such as those created by tax measures. This suggests that businesses are the more appropriate target for this aspect of taxation and the evidence indicates that businesses will tend to respond more predictably to (dis)incentives. This strategy is analyzed in greater detail below.
Because the government will need to spend large amounts of money investing in an economic transformation, the revenue and redistribution roles of the tax system are paramount. Without systemic changes to our tax system, the money spent will tend to accumulate with corporations and their owners, who have little public accountability to ensure Canada meets its climate and equity goals (see Box 2). In fact, they may actively work against those goals. The government will need to return public funds to public hands with the goal of rebalancing economic power. This was true when the Carter Commission issued their report and it is even more true now.
Who should pay?
Everyone will have to contribute to a just transition. The distribution of costs and benefits associated with the transition should account for 1) the different roles that individuals and corporations have played—and continue to play—in creating the climate crisis, and 2) the contributions each is capable of making toward the most equitable and effective transition to a green economy.
Wealthy Individuals
Wealth and income are strongly related to emissions. Globally, those with the highest 10% of incomes are responsible for almost half of greenhouse gas emissions, while the bottom half of the global population produce just 12% of emissions.[23] In per capita terms, the richest 0.1% emit ten times the next 9.9% (Figure 4).[24]
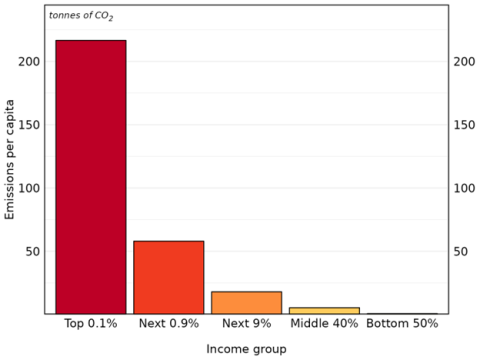
Figure 4: Emissions by global income groups, 2015[25]
Within Canada, the excessive emissions by the wealthy has undermined the country’s ability to meet emission targets. Since 1990, Canada’s emissions have decreased by a modest 3.1 tonnes per person. However, when we look at the distribution of emissions, we find that the bottom 90% reduced their emissions by almost 5 tonnes per person, while the top 1% increased their emissions by 34 tonnes per person (Figure 5).[26]
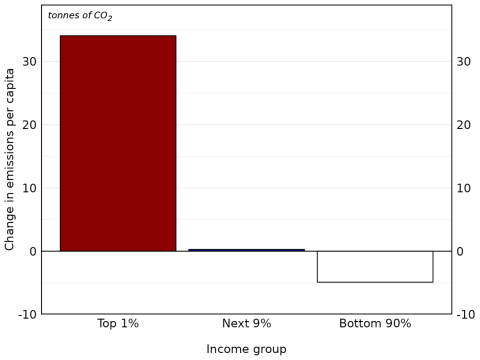
Figure 5: Change in emissions per capita, Canada, 1990-2019[27]
Decades of implicit and explicit subsidies for fossil fuel development has been a major factor in Canada’s relatively high standard of living (see Box 3: ‘Government subsidies for fossil fuels’). These subsidies attracted investments, reduced production costs, enabled higher profit margins, lowered relative prices, and increased sales volumes. This helped to make fossil fuels the most profitable non-financial sector in North America. A significant portion of the profits were then funnelled to the owners of these fossil fuel companies. Over the past 45 years, North American-listed fossil fuel companies have distributed $3.3 trillion (USD) through dividends and share buybacks, and another $1.4 trillion (USD) in interest payments.[28] Oil giant Exxon has paid more total dividends than any other North American corporation since 1977. It has done so with full knowledge of the damage they were doing because the company has accurately modelled the impact of carbon emissions since at least 1977.[29] Exxon has also been at the forefront of perpetuating climate skepticism and combating climate action.[30] Among Canadian non-financial corporations, fossil fuel companies have been five of the 10 largest distributors of profits to shareholders since 2000 (Figure 6).
Figure 6: Total distribution by Canadian non-financial corporations, 2000-22
|
Company |
Dividends |
Share Buybacks |
Total Distributed to Shareholders |
|
Enbridge |
$51.4 |
$2.4 |
$53.9 |
|
Bell |
$43.7 |
$7.4 |
$51.1 |
|
Thomson Reuters |
$22.5 |
$27.5 |
$50.0 |
|
CNR |
$17.8 |
$30.8 |
$48.6 |
|
Suncor |
$22.5 |
$20.3 |
$42.8 |
|
TC Energy |
$34.3 |
$2.1 |
$36.4 |
|
Imperial Oil |
$10.3 |
$25.5 |
$35.7 |
|
Nutrien |
$14.2 |
$21.5 |
$35.7 |
|
Canadian Natural Resources |
$20.3 |
$11.3 |
$31.6 |
|
TELUS |
$18.5 |
$5.4 |
$23.9 |
Note: Values in billions.
Most of the money distributed by fossil fuel companies went to the wealthiest households, who own a large majority of corporate equities.[31] Moreover, a majority of the wealth created by Canada’s oil sands is funnelled to foreign owners and investors, leaving Canada altogether.[32]
Workers in the fossil fuel industry have not received a fair share of the wealth they helped create. Since 2010, fossil fuel sectors have claimed $1.61 in operating profits for every dollar paid to labour (Figure 7). While billions of dollars continue to flow to executives, shareholders, and lenders, workers are highly vulnerable to economic harm from the fossil fuel companies’ failure to transition the industry. This needs to be accounted for as we deal with the impacts of climate change and the costs of transitioning to a post-carbon economy.[33] The tax system will be a key mechanism to allocate those costs.
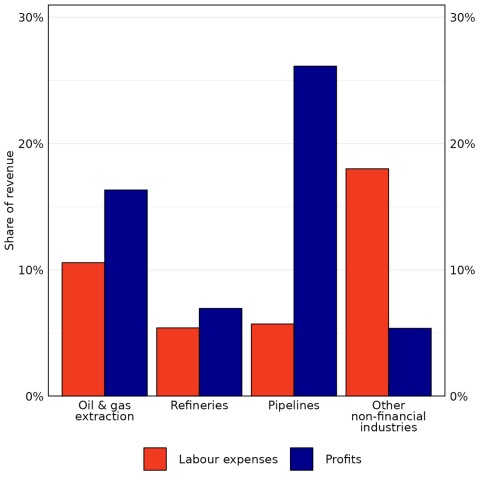
Figure 7: Share of revenue going to profits and labour, 2010-21[34]
To sum up, a small minority of individuals have significantly increased and concentrated their wealth from our carbon intensive economy, and they continue to be outsized contributors to emissions. Further, their wealth and power enables adaptability and mobility that provides greater protection from the negative impacts of climate change and the transition to a green economy. That means, under our current system, those primarily responsible for the crisis will bear the least cost for its harms. Thoughtful tax policy can ensure that the wealthy contribute a more just share toward climate transition.
Corporations
Corporations command much more of the Canadian and global economy than they did when the Carter Commission issued their report. In the first half of the 1970s, the annual sales of Canadian corporations were 59% greater than Canada’s GDP.[35] By the 2010s, corporate sales were 93% greater than GDP. Corporations have been able to turn this increased control into higher profit margins. From an average margin of 5.2% in the 1990s, the margin rose to 8.8% in the 2010s, and reached a recorded high of 12.4% in 2021. The biggest corporations pushed their margins even higher.[36] It is reasonable to conclude that some part of this corporate expansion is a result of largely uncontrolled and uncosted GHG emissions.
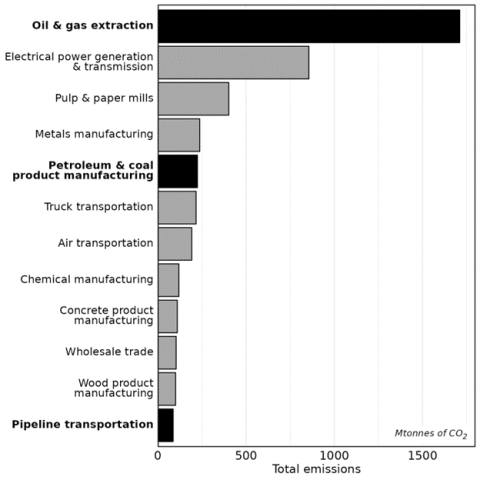
Figure 8: Canada’s biggest emitting sectors, total MtCO2 (2010-9)[37]
Of course, the biggest corporate contributors to historical emissions are those in the fossil fuel sectors. Among Canadian sectors, oil and gas extraction has produced the most emissions, by far (Figure 8). Refineries and pipelines are also among the twelve biggest emitters. These sectors also happen to be among the largest and most profitable (see Appendix 1). And, the companies within these sectors are some of Canada’s largest and most profitable (see Appendix 2).[38] Unfettered disposal of emissions constituted a massive indirect subsidy—in addition to all the direct subsidies—that propelled them to these positions (see Box 3). However, the corporate beneficiaries extend beyond the fossil fuel companies. In Canada, the most notable beneficiaries are the Big 5 Banks, which are intimately linked to fossil fuels.[39]
Corporations will also be major beneficiaries of public climate spending as money used to mobilize materials and labour will inevitably pass through corporate hands, where portions will be claimed as profit (see Box 2). While some of that profit will be distributed to owners, some will be retained by the corporations. Some of those retained profits might be invested to create good jobs, and produce goods or services that benefit all Canadians. However, as with the money controlled by wealthy individuals, the money controlled by corporations may also be spent on non-productive—or even socially harmful—activities, such as excessive executive bonuses, lobbying against taxes, or PR campaigns that undermine climate action.[40]
The logic of taxation according to economic power, which the Carter Commission established for individuals, should be extended to corporations. The most powerful corporations have been outsized beneficiaries of past emissions, and their wealth and power continues to grow as a result of high emission activities and products. The process of transitioning to a net zero economy will make some corporations more powerful and others less powerful. The government must acknowledge and compensate for this as part of ensuring the transition is fair.
Tax System Overview
In the following section we analyze the climate consequences of Canada’s rules around taxable income as well as major tax expenditures that result from various tax breaks. For an overview of how the tax system is structured in Canada see Box 4: ‘Canada’s tax system’.
Personal Income Tax
Federal personal income tax rates are progressive. Incomes are divided into brackets, with the portion of income in a higher bracket subject to a higher tax rate.
Figure 9: Canadian income tax brackets, 2023.
|
Income bracket |
Bracket rate |
|
$15,000 and below |
0% |
|
$15,001 to $53,359 |
15.0% |
|
$53,360 to $106,717 |
20.5% |
|
$106,718 to $165,430 |
25.0% |
|
$165,431 to $235,675 |
29.0% |
|
$235,676 and above |
33.0% |
As we established, higher incomes are associated with higher emissions as well as reduced vulnerability to the financial and environmental risks of climate change and economic transition. By drawing more money from higher incomes, personal income tax rates and brackets can fairly support Canada’s climate progress. However, that does not necessarily mean that the progressiveness is adequate. The current government improved the progressiveness of the federal personal income tax by reducing the rate on the third bracket and adding an additional bracket at the top, but more revisions are needed. Historically, our sense of fairness has demanded a progressive personal income tax, the climate crisis makes it even more essential.
Taxable income is total income less allowed deductions. What is counted in total income is almost universal among individuals with the large, glaring hole of capital gains. Only half of realized capital gains are included, which means the other half is not taxed. In 2019, individuals with incomes greater than $100,000 (approximately the top 10%) received 37% of total income, but claimed more than 80% of all taxable capital gains. No other income source is as unequally distributed, which makes capital gains exclusion very regressive.
The capital gains exclusion appears to invert the progressiveness of the income tax system at the very top. In 2019, the top 0.01% of incomes—above $3.9 million—had a lower effective tax rate than the rest of the Top 1%.[41] Regressive tax measures such as the partial exemption of capital gains violate basic tax fairness principles, worsen inequality, and harm the climate.
Personal Income Tax Expenditures
Most of Canada’s personal income tax expenditures are regressive, resulting in lower effective tax rates for high income individuals.[42] Particularly important, from a climate fairness perspective, are tax credits beyond the basics for age, spouse, disability, and tuition.[43] These include credits for charitable donations, foreign taxes, dividends, and some investments. The top 10% of tax filers collect almost three-quarters of these credits, with close to half going to the top 1%.[44] The federal dividend tax credit accounts for the majority of the benefit going to the wealthy. This credit is part of a complex calculation intended to compensate shareholders for corporate income taxes. This works against Canada’s climate goals in two ways. First is the highly regressive nature. Second is the fact that fossil fuel corporations have paid out a significant portion of dividends, distributing an estimated $149 billion to Canadians since 2010.[45] Profits made from high-emissions activities were distributed to the highest-emission individuals.
Corporate Income Tax
As with personal income tax, the corporate tax base only includes half of realized capital gains. The exclusion generally favours the largest sectors and corporations. This has climate consequences through two channels. First, energy use per capita is correlated with firm size.[46] Countries with larger firms have higher per capita energy use. Second, larger firms have greater income disparity and will contribute more to the highest incomes, which we have established produce a disproportionate share of emissions.[47]
Tellingly, among non-financial corporations, the oil and gas extraction sector had the second-largest share of capital gains over the pre-pandemic decade. Over those ten years, Canada’s largest emitter of carbon had capital gains of $34.2 billion. The exclusion of half those gains from taxation saved the sector $4.7 billion. Refining and pipeline companies saved a combined $1.5 billion.
Allowed operating deductions result in corporate taxable income being about 3% below the pre-tax book profits reported to shareholders. The largest aggregate deduction is the capital cost allowance (CCA), which reduces a company’s taxable income for investment in productive capacity, such as new machinery (see Box 5: ‘Depreciation & Capital Cost Allowances’). Another significant deduction allows corporations to count income losses from previous years against their current year’s taxable income.
For 2010 through 2019, the oil and gas extraction sector was the largest claimant of CCA. Companies in fossil fuel sectors claimed a combined 12.7% of all CCA deductions. Oil and gas extraction companies also claimed 9.5% of all deductions for previous year losses, more than any other sector.
The large deductions for CCA and previous year losses by fossil fuel companies is a significant mechanism by which the public subsidizes the continued development of the country’s fossil fuel industry. Altogether, fossil fuel companies claimed hundreds of billions in deductions over the decade before the pandemic through these two measures alone, moving Canada further from its climate goals (see Figure 10).
In 2021, the PBO analyzed several expense deductions available to the fossil fuel sector, including exploration expenses, development expenses, and acquisition expenses.[48] From 2015-9 these deductions cost the government $9.2 billion. That means the Canadian public subsidized the continued expansion of fossil fuel extraction, as well as greater concentration within the sector.
Figure 10: CCA and prior year loss deductions by fossil fuel sectors, 2010-9[49] Note: Values in billions.
|
Sector |
CCAs |
Prior year losses[50] |
|
Oil & gas extraction |
$93.82 |
$28.00 |
|
Refineries |
$23.14 |
$9.16 |
|
Pipelines |
$17.93 |
NA |
Corporate Tax Rates
The federal corporate income tax rate of 15% applies to all corporations, regardless of size or sector, with a couple of notable exceptions. There is a small business rate applied as a tax expenditure and the recently introduced surtax on banks and life insurance companies.[51]
The flat corporate income tax rate means that the largest, most profitable corporations are taxed the same as smaller or less profitable corporations. It also means that high-emission profits are taxed the same as low-emission profits. Both consequences undermine Canada’s climate goals. By almost any measure, larger corporations have more political economic power than smaller corporations. They engage in more lobbying.[52] They spend more on advertising. They hold more cash. They avoid more taxes.[53] And, unsurprisingly, they have higher profits.[54] As noted above, more economic concentration also coincides with more energy use, which is a strong indicator of higher emissions. Fossil fuel corporations remain among the largest and most profitable in Canada, having the largest operating profits among all non-financial corporations for 13 of the last 20 years, and every year since 2017.[55] Unfortunately the situation has not been rectified by Canada’s carbon pricing system, discussed in more detail below, which only taxes a small fraction of the emissions from these corporations.
The low level of Canada’s corporate income tax rate—the result of decades of cuts by both Liberal and Conservative governments—were justified by claims that it would increase private sector investment. In fact, studies show low taxation is not linked with economic growth and private sector investment has been on a decline during this period of time.[56]
Corporate Tax Expenditures
Corporations are offered many tax breaks through deductions and credits—counted as tax expenditures—for a variety of reasons. Since 2010, the range of expenditures has reduced total corporate taxes by 35%.[57] One of the largest of these is the investment tax credit for scientific research and experimental development (SR&ED).
The obvious problem with the SR&ED investment tax credit from a climate perspective is largely due to the benefits collected by the fossil fuel sectors. Extraction companies have collected an outsized share of the SR&ED investment tax credit, although it has also been falling. From 2010 through 2019, with less than 3% of taxable income, they received over 8% of the investment tax credit. Refineries also claimed an outsized portion. It is possible that the credits claimed by fossil fuel companies were aimed toward emission-reducing R&D. However we cannot determine if that is the case and there is no restriction on the credit. Research finds that little R&D activity by fossil fuel companies is devoted to developing low-carbon technologies.[58] Even if the credits were going toward lowering emissions, the public should not be “incentivizing” such investment by the country’s most profitable sector. Including the SR&ED credit, the fossil fuel sector received specific tax credits worth over $20 billion between 2010 and 2021.
StatCan data on tax credits aggregates most of them together. From 2010-9, the three identifiable fossil fuel sectors collected 9.8% of all ‘other’ credits claimed by non-financial companies.
Figure 11: Total Fossil Fuel Tax Credits, 2010-21 (millions)[59]
|
Sector |
Investment tax credit |
Other tax credits |
Total tax credits |
|
Oil & gas extraction |
$1,600 |
$11,862 |
$13,462 |
|
Refineries |
$544 |
$4,727 |
$5,271 |
|
Pipelines |
$13 |
$1,427 |
$1,440 |
|
TOTAL |
$2,157 |
$18,016 |
$20,173 |
Overall, tax credits for non-financial corporations reduced their taxes by 24%. However, they have provided outsized benefit to fossil fuel sectors (Figure 12). Tax credits allowed the oil and gas extraction sector to reduce its taxes by almost 40%.
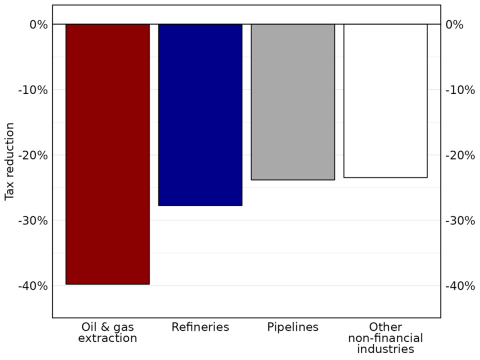
Figure 12: Savings from Tax Credits, 2010-21[60]
The largest tax expenditure ever was the Canada Emergency Wage Subsidy (CEWS), which distributed more than $100 billion to corporations over 2020 and 2021. Many large, profitable corporations claimed CEWS.[61] While the subsidy was ostensibly intended to keep people attached to their jobs during the upheaval of the pandemic, the 2021 federal budget acknowledged that CEWS had a regressive distributional impact.[62]
Overall, corporate income tax expenditures are regressive and provide excessive benefit to fossil fuel sectors. This needs to be addressed as part of Canada’s plan for achieving a just, post-carbon economy.
Climate tax measures
With the 2023 budget the federal government introduced its most ambitious climate spending plans to date.[63] The vast majority of this spending is in the form of tax credits. This will be described in greater detail below. However, even before the well-publicized carbon pricing plan was brought into force in 2019, both Liberal and Conservative governments used the tax system for climate action objectives.
1992 - 2015
The first reference to climate change in a federal budget came in 1992.[64] In the budget speech, Progressive Conservative finance minister Don Mazankowski marked ‘global warming’ as a priority, removing the excise tax on the methanol and/or ethanol portions of blended fuels. From the federal government’s earliest efforts to act on climate change, the issue was made into a tax matter. Tellingly, that effort ultimately benefited the fossil fuel industry.
The Liberal government of Jean Chrétien had signed the Kyoto Protocol in December 1997, claiming they would be investing over $170 million per year in direct spending to combat climate change. However, the government also connected Canada’s commitment to reduce emissions with “tax changes to move toward a more level playing field between renewable and non-renewable energy” that had been made in the 1997 budget.[65] The connection between climate action and the tax system was firmly established.
In 1999, the government explicitly connected climate change with an adjustment to the tax rules for productive investment by offering an accelerated capital cost allowance (CCA). Companies could accelerate deductions made for investments in equipment that converted byproducts of fossil fuel production into electricity instead of being flared off.[66] In other words, after a decade in which fossil fuel companies had taken over $53 billion in pre-tax profits—more than any other non-financial sector, the government provided a tax break for investment in equipment that would save the sector money.[67] Chrétien/Martin governments offered climate-justified expansion of CCA benefits in almost every budget. The fossil fuel sector has continually benefited from climate action even as it has undermined public efforts to deal with the worsening crisis.
The government of Prime Minister Stephen Harper notoriously became the first signatory of the Kyoto Protocol to withdraw from the agreement, pointing out that emissions had continued to climb under their predecessors.[68] However, the Harper government continued the practice of expanding accelerated CCAs with their first budget in 2006. Accelerated CCAs were offered and amplified for investment in clean energy generation and distribution. The governing Conservatives also offered accelerated CCAs for the storage and transportation of CO2. This was part of supporting development of carbon capture and storage technologies, which has been the long-preferred option of the fossil fuel sector for responding to the climate crisis.[69] However, the technology remains highly uncertain and it is widely expected to have a marginal impact, at best. Worse, if the technology is used to justify continued fossil fuel development, it could increase emissions.[70]
In 2009, the Harper government agreed with its G20 partners to “rationalize and phase out over the medium term inefficient fossil fuel subsidies.” As part of meeting this caveat-laden promise, the 2012 budget targeted the Atlantic Investment Tax Credit for Oil & Gas. The government had previously targeted a fossil fuel friendly tax break in the 2007 budget when it promised to phase out an accelerated CCA for oil sands investments. But the phase-out was delayed until 2011 through 2015.
Current government
During the 2015 federal election campaign, putting a price on carbon was the centerpiece of the Liberals’ climate plan. Canada’s carbon pollution pricing system came into effect on January 1, 2019. It requires provinces and territories to meet a minimum price on fossil fuels and GHG emissions and establishes a federally-managed backstop for any jurisdiction that either requested to use the federal plan or did not meet the minimum.
The carbon pricing system combines a tax on fuels—the fuel levy—with an emissions permit and trading system for larger or trade vulnerable industries—the Output-Based Pricing System (OBPS).[71] The OBPS allows these emitters, which include oil and gas extraction companies, to pay a fraction of the cost of carbon in comparison to the fuel charge, allowing “free allowances” based on historic emissions.[72] Proposals to reduce emissions from the oil and gas sector through revisions to the OBPS or through a separate cap and trade program have been tabled.[73] The government also plans to offer “contracts-for-difference” that would guarantee the future price of carbon in order to provide greater financial certainty and incentivize investment in clean energy and technology production.[74]
The carbon tax gets an overwhelming amount of attention for climate action through the tax system. But it was implemented after the Trudeau government had continued the practice of using accelerated CCAs to deliver climate action. And every budget since has included more accelerated CCAs for investments related to reducing emissions, from purchasing zero-emission vehicles to construction of hydroelectric dams.
The current government’s tax-based climate action is not just introducing new tax measures. It also involves removing tax measures. The 2019 budget once again noted Canada’s commitment to “phase out and rationalize inefficient fossil fuel subsidies”. The government stated that this process had affected eight tax expenditures, including three since the Trudeau Liberals came to power. In 2022, another tax-based subsidy was targeted when the government announced that it would phase-out flow-through shares for oil, gas, and coal projects.
The government recently released its framework for assessing and identifying “inefficient” fossil fuel subsidies.[75] Only subsidies that meet a set of criteria will not be considered inefficient. Those criteria include subsidies for fossil fuel projects with a “credible plan to achieve net-zero emissions by 2030”. However, what constitutes a “credible plan” and the enforcement measures to assure compliance are undefined.
The 2021 budget saw the first mention of a new tax credit as part of the current government’s climate action to support investment in carbon capture, utilization, and storage (CCUS) projects. It also noted that the government would “analyze how the tax system can be used to further support the commercialization and deployment of breakthrough technologies that may be critical to creating our net-zero future.”[76]
The refundable CCUS tax credit, as well as a credit for mining exploration expenditures aimed at ‘critical minerals’, were introduced in the 2022 budget. There was also a promised tax credit for investment in ‘clean technology’ that was detailed more thoroughly in the Fall Economic Statement (FES).
With the 2023 budget, the government dramatically expanded the use of tax credits as part of its climate action. Altogether, the government committed $65.5 billion over ten years to “incentivize” industrial transformation via tax credits (Figure 13).
Figure 13: Estimated Cost of Climate Tax Credits, 2022-31
|
Measure |
Estimated cost** (millions; 2022/3 to 2031/2) |
|
CCUS Investment Tax Credit (2022)* |
$11,070 |
|
Critical Mineral Exploration Tax Credit (2022)* |
$872 |
|
Clean Technology Investment Tax Credit (2022 FES)* |
$14,155 |
|
Clean Electricity Investment Tax Credit (2023) |
$17,386 |
|
Clean Technology Manufacturing Tax Credit (2023) |
$9,590 |
|
Clean Hydrogen Investment Tax Credit (2023) |
$12,474 |
|
TOTAL |
$65,547 |
*includes the value of enhancements announced in Budget 2023.
**there is no cap on the use of these credits, so the expense could be much higher.
Analysis
Canada is relying heavily on tax measures to regulate market behavior and reduce emissions. The carbon tax notwithstanding, all but one of the federal government’s major climate tax measures have provided “carrots” to businesses.[77] These kinds of tax measures are commensurate with the government’s claim that it is taking a “market-driven” approach to the climate crisis. The current parlance on the use of “carrots” to coax private sector investment is “derisking”. While the government is using non-tax measures, including regulatory requirements, it is making tax measures—from the carbon price system to its new tax credits—the high-profile centerpieces of its climate action.
Until 2022, the measures primarily took the form of accelerated capital cost allowances, and are now largely in the form of tax credits. Overall, because these measures all benefit corporations, they are inherently regressive. The government acknowledges the fact that the tax credits are regressive in their GBA+ analyses. While the measures themselves are intended to reduce Canada’s emissions, their regressive nature will reduce the benefits. The regressiveness of the tax credits should be reduced by some of the laudable features promised by the government, particularly requirements on wage levels and apprenticeships. However, it will depend on how these requirements are designed and implemented. It is also notable that there are no conditions requiring actual climate benefits.
Carbon Pricing
Carbon pricing is the central pillar of the government’s climate plan, intending to make goods and services with higher emissions relatively more expensive, which will entice the buyers to choose lower emission options.[78] In turn, this is supposed to divert investment away from production with high emissions into production without net emissions. The fuel levy stands currently at $65 a ton and will rise to $170/ton by 2030. It is expected to reduce Canada’s emissions by 95 million tons annually.[79] Carbon taxes are typically regressive, however the fuel tax has a largely progressive impact as lower-income households receive more back in rebate then they typically pay.[80]
The results of Canada’s OBPS system are far more uncertain. It allows large emitters and trade vulnerable industries to produce emissions at very little cost, and does not ultimately cap emissions as other more effective systems do.[81] Importantly, as mentioned, the price paid by the oil and gas sector is heavily subsidized due to free allowances combined with a reduced per tonne rate. In addition, provinces determine how the revenue is used and distributed, with no assurances it will go towards emission reduction activities.[82] The government plans to offer additional market-oriented mechanisms as complements to carbon pricing, such as “contracts-for-difference”. While these are designed to provide greater certainty for investment, the design of these mechanisms remains the subject of heated debate. Designed improperly, they could become another subsidy for fossil fuel companies.[83]
CCAs
Capital cost allowances are the tax system’s way to account for asset depreciation (see Box 5). In theory, the CCA should match depreciation of the purchased asset. As noted above, the government will offer preferential CCA rates, which means a business can deduct more of the cost of an investment each year, reducing their taxable income. CCAs that consistently exceed depreciation indicate that companies in the sector are enjoying generous deduction rates.
Since 2000, extraction companies and refineries have claimed the second and third most generous CCAs, respectively.[84] Extraction CCAs were 71% higher than depreciation, while refinery CCAs were 41% higher. This cost the public $20.8 billion in tax revenue.[85] That means for at least two decades the tax system has been facilitating, if not encouraging, excessive development of fossil fuel production.
The excess of CCAs over depreciation has been trending downward for both extraction and refining companies. However, in 2021, the extraction sector had its largest CCA excess in 15 years. In fact, at $4.9 billion higher than depreciation, the sector had the largest excess among all non-financial sectors. Pipelines had the fifth largest excess at $1.4 billion above depreciation.
The fossil fuel sector needs to invest in emissions-reducing equipment. However, there is no evidence CCAs have induced this with any beneficial effect. The extraction sector’s emissions intensity—emissions per dollar of production—were 27% higher in the second half of the 2010s than in the first half.[86] In fact, as shown in Figure 14, several fossil fuel sectors had higher emissions intensity in the second half of the decade. Overall, the rest of Canadian industry reduced their emissions by 17%.[87]
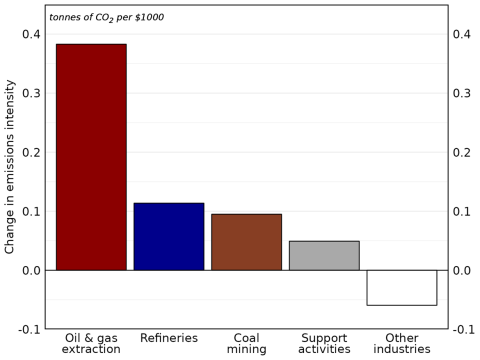
Figure 14: Change in emissions intensity, 2010-4 vs. 2015-9[88]
During the 2010s, the oil and gas extraction sector received $34.3 billion in excess CCA. Beyond the ineffectiveness of these CCAs, it is unclear why the government would offer tax breaks to entice investment by a highly profitable sector that has the means to pay for the investments outright, instead of mandating those investments with regulations.
Tax Credits
Tax credits have a role to play in the climate transition. They can create the desired incentive and perform as expected. There are some particularly positive features of the climate-oriented credits being offered to businesses. The most prominent of these is the inclusion of labour requirements.[89] While the requirements should be stronger, recognition of the need for such requirements is an important achievement. However, also important is the fact that non-taxable entities like publicly-owned utilities and corporations owned by First Nations, can collect the refundable Clean Electricity tax credit. A recent study on a similar provision in the U.S. Inflation Reduction Act argued that, if properly implemented, it carries “enormous promise” for a renaissance in public energy production.[90]
Tax credits can be a useful tool to incentivize climate action but there should be caution against the government relying too heavily on this method.[91] The effectiveness of tax credits is uncertain. Further, overreliance on the private sector can increase wealth and income inequality. In fact, the government’s GBA+ analysis shows that all of the climate tax credits are at least modestly regressive.[92]
There are also significant concerns that some of these tax credits will largely benefit fossil fuel sectors. As we have detailed, there is a history of climate action delivered through the tax system providing benefits to these sectors, so such concerns are well-placed. Of particular concern is the CCUS tax credit.[93] The credit will cost an estimated $1.1 billion annually—17% of the cost of all climate tax credits—to subsidize a technological solution, which continues to be of questionable effectiveness.[94] The new subsidy assessment framework includes allowances for subsidies that abate production, which protects the CCUS credit.
Even with billions of dollars being spent by the government, there is no assurance that we will achieve the necessary transition within the necessary timeframe. Research shows that government involvement is crucial for large scale projects and will be needed to mobilize and guide resources.[95] Tools such as direct government investment will be necessary to meet Canada’s climate goals. As shown in Figure 1, even if the necessary scale of federal spending is double or triple current estimates, it will remain well below the cost of WWII. However, regardless of the scale of spending, robust and fair taxation is essential to ensure a just transition.
Summary
Tax credits—and regulating behaviour via taxation generally—has a role to play in our climate solution. However, it cannot be the primary way that we try to transition our economy. There is far too much uncertainty about how tax measures will actually affect behaviour and achieve the necessary transformations. Instead, tax measures need to prioritize the far larger role of revenue-generation and redistribution, which will be vital in the process of achieving fair and sustainable economic transformation.
We’ve established that the Canadian government is already heavily relying on the tax system as part of its climate action. From the carbon tax, to accelerated CCAs and tax credits, a lot of the current government’s climate plan flows through tax mechanisms. This builds on a long-standing practice adopted by previous governments from the earliest days of the federal government’s climate response.
There are at least two problems with the way the tax system has been used. First, it has not been systematic. There is no evidence that the government confronted whether or not Canada’s tax system overall supports or hinders the country’s ability to meet its climate goals. This resonates with an overall shortcoming of the government’s approach to the climate crisis, which the Net-Zero Advisory Body described as “piecemeal”.[96] While some tax subsidies for fossil fuel companies have been targeted, much more needs to be done. For example, fossil fuel companies continue to claim an outsized share of investment tax credits and outsized benefits from the structure of capital cost allowances. These should be addressed as part of systematically applying a ‘climate lens’ to the tax system. Such an analysis would also consider how these new policies will fit into the existing tax framework, including the assessment, compliance, and enforcement functions of the Canada Revenue Agency. Second, it remains rooted in an idealized conception of market efficiency. As such, it tries to use the least economically impactful methods to achieve the transformation needed. While effective use of public dollars is essential, it is fallacious to assume a market-oriented is most effective.[97] Given the scope and scale of the problem, government action needs to be more ambitious. Accountability and fairness require more involvement and leadership from our public institutions.
Principles for ensuring the economic transformation is fair and inclusive
The carbon tax, accelerated CCAs, and tax credits are insufficient to accomplish the scale, scope, or speed of transformation necessary for a just transition to a green economy. Accomplishing this transformation, in a way that is fair and inclusive, demands a bold, democratic green industrial policy that is explicitly led by the public sector and accountable to Canadians. In order to support such a policy, Canada’s tax system needs to be revised..
Although the government’s use of accelerated CCAs and tax credits are a form of industrial policy, they fall well short of what is necessary and possible. Green Industrial Policy (GIP) recognizes the need for a comprehensive framework that addresses the shortcomings of both the public and private sectors and seeks to accomplish emission reduction goals while maximizing equitable benefits for the public. GIP can be contrasted with the current government’s “derisking” approach, which is based on free market ideology. By privileging private sector decision-making, the current approach undermines the development of public capacity, entrenches excessive corporate power, and gives too much credence to the short-termism of markets. By adopting a GIP, the Canadian government can better align environmental and economic goals, foster innovation, and create a more equitable society in the long term.
GIP principles
In our survey of literature related to GIP, we identified five key principles:
Alignment of economic growth and ecological sustainability
Ensure that economic growth is sought through sectors and activities that meet our ecological sustainability goals, leveraging the strengths of specific regions, to build resilient and adaptable economies.
Fair Distribution of Costs and Benefits
Benefits of the shift to a green economy must be shared equitably, while preventing the costs from disproportionately burdening vulnerable populations such as low-income communities, Indigenous peoples, and racialized groups.
Inclusive and Participatory Decision-Making
Policy design and implementation should involve input from diverse stakeholders, including labor unions, businesses, and community organizations, to ensure that diverse interests are represented. The legal rights of Indigenous nations requires their intimate involvement in all stages of industrial policy design. Policies should be transparent, with government accountability for their implementation and outcomes.
International Cooperation and Solidarity
Recognizing the global nature of the climate crisis and the crisis of inequality, international cooperation can lead to more effective and efficient solutions, sharing best practices, and pooling resources to address common challenges.
Inter-generational Equity
A just transition must be rooted in the idea of sustainability and long-term thinking, emphasizing the importance of preserving ecological systems, natural resources, and a healthy environment so that generations to come can meet their needs.
Tax Fairness
An update to our understanding of tax fairness, in the context of the climate crisis, should incorporate the principles of GIP. The Carter Commission’s firm commitment to equity remains paramount. However, the Commission’s famous slogan that “a buck is a buck”, reflecting its intention to include all income sources equally in the calculation of taxes, no longer holds. For over a century, the costs of carbon emissions, and other forms of ecological degradation, have not been included in the financial accounts. Many bucks have been unfairly collected from this externalization of costs. The carbon tax, if simply implemented at the full cost of carbon emissions, would be economically destabilizing and have dire consequences for many vulnerable communities. The government’s relationship with the economy through investment and taxation must be more intentional and reflect the green industrial policy principles described above.
Instead of designing taxes from the perspective of minimizing market distortion, let’s design taxes to support our economic, environmental, and social goals, while keeping fairness front and centre.
Global climate tax practices
Climate action plans around the world have been ramping up for at least a decade, with governments making large financial contributions.[98] Yet, the role of taxes within these plans continues to be overlooked and under-examined. As we have detailed above, Canada’s climate action has used the tax system in a number of ways. While the carbon tax has gotten most of the attention, accelerated CCAs and tax credits are being prominently used. Below we examine some of the ways that taxes are being incorporated into the more bold climate undertakings, plans and recommendations coming from Canada’s closest allies. These practices, both those implemented and those suggested, inform our recommendations for how the tax system ought to be revised.
The US Inflation Reduction Act
The IRA passed into law in August 2022 and with it, $288 billion in corporate tax credits and $57 billion in consumer tax credits for clean energy and emissions reduction.[99] Despite the similar use of tax credits, there are some key differences between the IRA and Canada’s climate plan. The IRA combines the tax credits with $180 billion in direct government investment—34% of overall climate spending—through grants, loans, and greening federal operations. Most importantly, the IRA puts in place new corporate tax measures. These include a minimum tax on book profits, a tax on stock buyback, and greater support for tax compliance enforcement. The tax measures in the IRA will more than cover the $525 billion spending on climate action. Importantly, by focusing on corporations, these measures target the likely financial beneficiaries of the IRA’s climate spending. While Canada’s 2023 federal budget includes a stock buyback tax, the revenue from all tax measures promised since the introduction of climate tax credits would cover less than two-thirds of the cost.[100]
The G7 and Global Economic Resilience
In late 2021, a panel of economists presented the G7 with a report on how governments can improve resilience to future shocks to the global economy.[101] One of their key recommendations is that governments lead investment in the transition because they are in the position to make long-term economic decisions, whereas private investment is largely run on short-term goals of return. They recommended that these investments be funded with broad corporate tax measures, emphasizing a tax on the digital giants and a minimum corporate tax. The panel proposed that governments fund research and development in newer green technologies while providing technologies already on the market with a greater market expansion through public procurement and predictable emission reduction regulations. Despite being explicitly tasked with finding “market-based policy options”, the report does not mention the use of tax credits. The report does, however, recommend imposing taxes based on certain corporate practices, giving the example of consuming rather than recycling materials.[102] In other words, the report explicitly advocates the use of tax “sticks” rather than tax “carrots”.
European Union and Taxation for the European Green Deal
The European Union has a number of climate tax measures already implemented or soon to be implemented. The EU has also produced documents that analyze and advocate for other tax practices as part of a ‘green transition’.
Major Climate Tax Measures Implemented
In 2020, the EU approved the European Green Deal, an overarching set of policy initiatives intended to build a fair economy that produces zero net emissions by 2050. One priority of the EGD is to create a broad set of tax reforms that result in, “removing subsidies for fossil fuels, shifting the tax burden from labour to pollution, and taking into account social considerations.”[103] The EGD is informing new and updated tax policies.
The EU has a relatively long-standing set of tax policies that are intended to complement the continent’s Emissions Trading System (ETS). Introduced in 2003, the Energy Taxation Directive (ETD) set minimum excise tax levels on fuels that member countries must achieve, while being free to design country-specific policies. The ETD is being updated to align with the European Green Deal.[104] As other climate actions have been implemented, broad exemptions in the ETD have rendered it ineffective. A recent proposal calls for previously exempt sectors—notably maritime and aviation—to be included. Importantly, member states have much less leeway to make exemptions on a national level. The updated tax will be assessed on energy content and associated environmental impact of the energy products. The tax will also be indexed annually.[105]
In October 2023, the EU will begin to phase in the Carbon Border Adjustment Mechanism (CBAM) in order to address the issue of “carbon leakage”. Nations and economic regions that put a price on emissions face the challenge of imports produced in jurisdictions with fewer restrictions on emissions. CBAM will require importers to report the “embedded emissions” of an imported product—the emissions created during its production—as well as any taxes or levies paid on those emissions.[106] The CBAM calculates the price of those emissions under the EU’s Emissions Trading System (ETS) and charges importers the difference. The first sectors to be required to report under the CBAM are some of the most carbon intensive and considered the most vulnerable to carbon leakage. These include cement, iron and steel, aluminum, fertilizers, electricity and hydrogen. CBAM is expected to be fully implemented by 2026, and aligns with phasing-out the free allocation of emissions credits under the ETS.
The EU has also introduced a levy on member states based on their plastics usage, which effectively constitutes a “plastic tax”, as part of its European Green Deal.[107] Each member state is able to design the tax it prefers as a way to collect the revenue for its contribution. Some members will tax the manufacturers and importers of plastics. Others will tax the consumers of plastics. The tax is expected to provide EUR 6 to 8 billion in revenue to the EU although its primary purpose is to reduce plastic use.
Climate Tax Recommendations and Other Relevant EU Tax Measures
In 2021, the European Commission published an extensive review and inventory of tax measures used to aid in a green economic transition. The study’s authors found that carbon taxes are the most effective at reducing emissions. Regarding the use of tax incentives, such as tax credits, the report bluntly states, “Tax incentives are … probably the least important … instrument to further environmentally beneficial behaviour and decisions.”[108] The study provides a number of insights into how incentives can be best structured if they are used, but it recommends that governments focus on three objectives when implementing climate tax measures: 1) whenever possible, target emissions directly because proxies—such as the age of a technology—are not as effective, 2) prioritize taxes over tax incentives because they have a far greater impact, and 3) reduce harmful subsidies and incentives while implementing any necessary complementary measures to address impacts on social equity or economic competition. Just like the G7’s panel of economists, the report clearly advocates for “sticks” over “carrots”.
The most notable example of a recent tax stick used in Europe has been the implementation of windfall profit taxes on the profits of fossil fuel companies. The European Commission recommended a minimum 33% tax on fossil fuel companies’ “surplus profits”, which were defined as profits above 120% of historical norms.[109] This tax returns a portion of unearned profits to public hands. It also creates a disincentive for companies to take advantage of economic turmoil and exercise their market power to hike margins.
The European Commission’s review of climate tax policies noted that tax carrots are best employed in situations where there are “positive externalities” such as research and development (R&D). For example, the costs of learning-by-doing are borne by early innovators but can benefit others within a sector. Tax incentives can induce R&D that might otherwise not be undertaken because early participants bear excess costs. As described above, one of Canada’s major tax expenditures is the provision of an investment tax credit for R&D. However, oil and gas extraction companies have claimed a large share of this expenditure. Recently, Italy and Portugal have updated their R&D tax incentives to preferentially support ecologically-oriented projects.[110]
One of the most popular tax incentives used by European countries is intended to encourage consumer uptake of zero-emission vehicles. However, these were considered significantly less effective than those for R&D. Tax incentives for consumers were most effective when combined with tax disincentives. For example, reducing the tax on a vehicle with lower emissions worked best when the tax was also increased on vehicles with higher emissions.[111] It was also noted that tax incentives for climate-friendly vehicles also had negative distributional consequences.
Other Climate Consumption Taxes
Other kinds of taxes—particularly consumption taxes—have been suggested or reframed as climate taxes. The EU’s plastic tax is one example. Some argue that luxury goods should have a higher carbon tax. Targeting luxury goods would be one way to deal with the greater climate impact of consumption by the wealthy.[112] Economic modelling shows that a higher rate on luxury items would be more effective at reducing emissions than a flat carbon tax, in addition to more fairly allocating the cost of the tax.[113] Canada recently introduced a luxury tax. However, it was not connected with climate change. Another suggested target for climate taxes is aviation. One potential form for the tax could be an escalating levy on each flight taken.[114] This would counter the regressive nature of consumption taxes.
Summary
Climate tax measures can take many forms. In behavioural terms, they can offer incentives through tax breaks, or they can create disincentives through higher tax rates. The European Commission’s comprehensive analysis of green transition tax measures stated that incentives and disincentives need to work together, with the disincentives being more important. But they can—and should—consider the revenue and redistribution effects. The United States’ Inflation Reduction Act, which implemented its most significant climate spending, included important revenue generating and redistribution tax mechanisms focused on the largest corporations. Although they are intended to address a different problem—corporate tax avoidance—the largest corporations are historical beneficiaries of carbon subsidies and many will likely benefit from IRA spending. This gives the tax measures the added virtue of making those who most benefitted from historical emissions, and continue to benefit from current emissions, pay for the climate spending.
Recommendations
Markets do not exist in the absence of governance. From the laws that protect property rights to the international standards on weights and measures, governments are essential for markets to function.[115] And, taxes are an essential component of government. Taxes, markets, and market outcomes are not mutually exclusive.
A green industrial policy would make explicit the government’s indelible role in the economy and its responsibility to lead a just transition to a green economy. That leadership will require large investment in economic transformation, with fair taxation as part of fiscal management to support it. But taxes do more than just generate revenue for governments. They also redistribute income and wealth, and regulate behaviour. Redistribution needs to play a greater role to 1) reduce the extraordinary climate harm caused by wealth and income inequality, 2) provide more resources to vulnerable communities, which bear the brunt of climate impacts, and 3) prevent climate spending from adding to wealth concentration. Behaviour regulation needs to use both carrots and sticks, and should focus on businesses, which respond to financial incentives in a much more straight-forward manner than individuals.
The particularities of tax design and implementation are always complicated. There are challenges to ensure that taxes are applied appropriately and effectively. Using taxes as part of climate action compounds these difficulties. Trying to fine-tune and target taxes as a way to decrease emissions faces issues with data gathering and analysis to ensure compliance. The fact that climate change is a global problem also means there are coordination issues across jurisdictions. Unfortunately, we lack a global body authorized to ensure coordination of investment and taxes.
Given the difficulties of tax design, our recommendations are focused on broad measures for revenue and redistribution as a way to better balance economic power. However, we also recommend changes to the existing tax measures to more effectively match “sticks” with “carrots”. We also recommend ways to improve the government’s plan to end subsidies for fossil fuels.
With the principles of green industrial policy and tax fairness in mind, we recommend the following changes and additions to the tax system.
Support public investment and rebalance economic power
1. Implement a wealth tax.
A wealth tax has long been advocated as a way to improve economic equality.[116] However, it would also address the primary beneficiaries of past carbon emissions, and the outsized climate impact of the wealthy. A progressive tax on fortunes greater than $10 million—affecting less than one half of one percent of Canadian households—would bring in more than $400 billion over ten years.[117] A portion of that revenue should be devoted to international assistance for areas of the globe paying a heavy toll for the climate crisis. Affected populations in those areas typically have gained the least benefit from historical emissions.
2. Fully tax capital gains.
Capital gains exclusion overwhelmingly benefits the wealthiest Canadians. In order to mobilize investment toward productive purposes, the government should eliminate this loophole and lead with its own investment, rather than leave in place an extremely regressive tax measure that is not getting us the kind of investment that is needed.[118]
3. Create a windfall profit tax.
Windfall taxes are useful for returning public money to public hands. They also create a disincentive for companies with pricing power to hike profit margins when demand increases. During World War II, the government imposed an 80% excess profit tax to discourage war profiteering. It taxed the excess at 100% and provided a 20% refund after the war.[119] As noted above, the EU has implemented a windfall tax on oil and gas companies as part of returning excess profits to the public.
Additional measures to consider.
1. Make the corporate income tax progressive.
Applying the logic of the Carter Commission, because of their greater economic power, corporations with higher levels of profit should pay a higher marginal tax rate. As with the individual income tax system, this reasoning is even more important in the context of the climate crisis.
2. Increase the progressivity of the personal income tax.
Adding more top tax brackets would redistribute economic power and provide revenue from the government’s spending on economic transition. It would also signal the government’s commitment to following the recommendation of the Carter Commission to allocate taxes according to economic power.
Add “sticks” to match environmental “carrots”
1. Create conditions for clear public benefits from green tax credits.
The government has promised labour conditions for some of the newest tax credits. While the design of these conditions is still being worked out, the initial descriptions are underwhelming. The kinds of jobs covered are very limited, and disproportionately employ men. The credit is still available to employers that fail to meet the conditions, although at a lower rate. Labour conditions need to be strengthened, with particular attention to those under-represented in the current labour market, and supplemented with additional conditions.
2. Comprehensive labour protection.
All climate tax credits should include labour conditions that assure fair wages across a broader range of jobs and greater employment opportunities for marginalized workers. Employers should be required to meet them to qualify. If a project cannot be feasibly undertaken while meeting these conditions, but is essential to a just transition, then direct public sector leadership and investment is likely required.
3. Alignment of investments with national climate commitments.
Recipients of credits for clean technology investments should be required to have a plan to achieve measurable benchmarks that align with Canada’s carbon reduction commitments. Failure to achieve benchmarks should result in a clawback of the credit.
4. Public disclosure of credit recipients.
The public deserves to know which companies are claiming which credits. This will improve the transparency and accountability of claimants and help ensure investments are actually beneficial.
5. Penalties for ineligible claimants.
Tax credits create incentives not only to invest in qualifying activities but also to game the tax system. Penalties for attempting to claim the credit without actually qualifying would discourage this kind of tax avoidance.
6. Advance refundable credits to qualifying not-for-profit enterprises.
As mentioned above, the 2023 budget is making the tax credit for investment in clean energy generation and distribution available to non-taxable entities like public utilities. The IRA has a similar provision with an important addition that these funds will be provided to qualifying entities upfront. The Canadian government should follow suit. This should also serve as a model to encourage more investment in climate transition by not-for-profit enterprises, such as non-profit cooperatives, and generally incentivize the creation of purpose-built not-for-profits in the burgeoning green economy.
2. Strengthen the carbon pricing system
The current government has expended a great deal of effort getting a nationwide system of carbon pricing in place. While this is a significant achievement, there remain shortcomings with the system. Most notably, the oil and gas sector, among others, continues to receive preferential treatment. The reasons for this treatment are understandable. However, there are solutions that would make the system more fair.
1. Implement a carbon import tariff and carbon export refund.
The government has significantly reduced the cost of carbon for some of Canada’s highest emission industries because they are “trade exposed”, and the cost of the carbon levy would put them at a competitive disadvantage. This can be resolved by 1) imposing a tariff on imports from countries without comparable carbon pricing, sometimes referred to as a carbon border adjustment, and 2) providing a refund on the carbon price for exports intended for markets with lower or no carbon pricing to keep Canadian goods internationally competitive. The government has undertaken consultation on a “border carbon adjustment” but has not provided a timeline for introduction.
2. Phase out free allowances in the OBPS
As we have described, free disposal of emissions allowed the fossil fuel sector to overdevelop and to generate excessive profits. This unfair advantage is maintained by the free allowances of the OBPS. As the import tariff and export refund system is implemented, the free allowances now generously granted should be phased out. The EU has recently proposed a similar approach as discussed above.
3. Monitor and address distributional impacts.
As noted, the existing carbon tax is modestly progressive based on how the rebates are distributed. Going forward distributional impacts need to be continually monitored and, if unfair, addressed. One of the most prominent is the relative impact on rural households, which tend to be more reliant on fossil fuels and therefore more heavily hit by the carbon tax. Remote Indigenous communities that depend on gas generators and long-distance transportation of goods may also be unfairly impacted. Folks that are under-served, such as the unhoused, could be missing out on their carbon tax rebates. Other unforeseen harms may be disproportionately affecting members of vulnerable communities. All of this should be monitored.
Additional measures to consider.
1. Directly tax high-emission assets and/or dividends.
It is an axiom among economists that if you want less of something, you tax it, and if you want more of something, you subsidize it. The axiom suggests that ‘dirty’ bucks from high-emission sources should be taxed more heavily than ‘clean’ bucks. Dirty assets should be taxed directly as part of reducing their prevalence. The revenue could help rehabilitate lands despoiled by already abandoned wells. However, the tax should not be a substitute for industry financing the clean-up of current assets. This would be a type of ‘capital tax’, which Canada actually uses in a very limited way on the taxable capital of financial institutions above $1 billion.
Using a differential tax rate on dividends has a precedent in the treatment of domestic vs. foreign dividends. This is intended to encourage investment dollars to remain in Canada and help maintain Canadian ownership of domestic assets, which was one of the taxation goals identified by the Carter Commission. We similarly want to encourage more investment in lower emission assets.
Aggressively and comprehensively eliminate publicly-funded support for fossil fuels.
The Trudeau government has provided an assessment framework for identifying subsidies that are “inefficient”. However, the plan for subsidy elimination continues to lack clarity and contains problematic loopholes. Further, the policies covered are narrowly defined and exclude other kinds of support, including some within the tax system
1. Clarify assessment criteria for ‘inefficient subsidies’.
As currently described, the assessment criteria leave too much room for interpretation. Clear metrics and thresholds are needed to allow for external assessment. This is essential to prevent wasteful support and ensure public accountability.
2. Provide a public timeline for eliminating subsidies and other supports.
The federal government should make public any “inefficient” subsidies it identifies and provide a timeline for their elimination.
3. Identify and eliminate other public supports, such as overly generous CCAs.
Our tax analysis shows that fossil fuel sectors have benefited from excessively generous CCA rates, but similar to the publicly-funded financial support recieved from Export Development Canada, it is likely that they will not be considered ‘subsidies’ under the current framework.[120] There are likely other supports, both intentional and unintentional, within federal policies. Whether through broadening the criteria of the assessment framework or by other means, these supports need to be identified and eliminated as part of achieving our climate responsibilities.
4. Monitor and address distributional impacts.
Workers and communities that have become dependent on fossil fuel production should not bear the cost of eliminating public supports for the industry. Where these groups are being harmed, public supports should be offered.
EXPLAINER BOXES
Box 1: Money-creation & fiscal management
Recently, it has become more widely understood that countries that issue their own currency do not need to acquire financial resources in order to spend.[121] These countries have what some refer to as “monetary sovereignty”, which includes Canada. Currency-issuing governments literally spend money into existence.[122] Unfortunately, some misinterpret this fact to mean that these governments do not need revenue.[123] This is incorrect for two reasons.
First, while the Canadian government does not need to acquire financial resources in order to spend, all governments must acquire non-financial resources regardless of their money-creation capabilities. By focusing on the money, “the shadow is mistaken for the substance.”[124] Governments used to levy non-financial resources from their populations. As recently as the 1920s, Alberta municipalities accepted labour as a form of tax payment.[125] Without getting into the messy debates about the nature of money, we can state that money represents an unfulfilled claim on goods or services.[126] The Government of Canada can use its unique money creation capability to make such a claim. But it cannot do so endlessly. Goods and services used by the government become unavailable to households and businesses, at least temporarily. Those goods and services are used for public provision, rather than private provision. Taxes are a way of making everyone contribute to public provisioning.
Second, we can turn to etymology to help us understand the role of revenue in the federal government’s fiscal operations. The Old French origin of ‘revenue’ means “a return”.[127] Revenue-generation by a currency-issuing government is a way of returning publicly-created money back to public control. Stephanie Kelton, a prominent figure advocating for greater understanding of monetary sovereignty, makes the point that the idea of ‘tax-and-spend’ (or ‘borrow-and-spend’) is not applicable to money-creating governments.[128] Rather, those governments spend-and-tax(-or-borrow). Taxes are a way of returning spent funds to the public that originated them.
Once spent into an economy, public money will circulate and concentrate. Households and businesses will respond to the intertwining effects that this money has on spending, saving, investment, prices, and exchange rates, as well as income and wealth distribution. Money-creating governments have a fiscal responsibility to manage monetary flows, including to reduce unequal economic power. Taxes are a key mechanism in this regard.
Box 2: Government spending & corporate profits
In 2021, Canadian corporations had after-tax profits of $518 billion, which is a record high by a wide margin.[129] Where did those profits come from? There are lots of possible microeconomic explanations for the profits of a particular business or sector. Was it a cost-cutting innovation? Was it market power-enabled price-gouging? We will continue to debate these particulars as long as there are private sector profits. However, we can also gain valuable insights from a macroeconomic perspective.[130]
Likely the best known equation in macroeconomics is
Y = C + I + G + (X - M)
This is Keynes’ national income identity for an open economy where,
Y: national income,
C: consumption,
I: investment,
G: government expenditure,
X: exports,
M: imports.
We can rearrange the equation into
Y - C = I + G + (X - M) and recognize that income less consumption equals savings (S), which we can decompose into business savings (SB) and nonbusiness savings (SNB).
SB + SNB = I + G + (X - M)
Business savings are equivalent to after-tax profits (P) less dividends (D).
With slight rearrangement, we can construct the following identity,
P = I + G + (X - M) + D - SNB
Therefore, we can say—by identity—that aggregate after-tax profits rise when dividends, exports, investment, or government expenditures increase, and fall when imports or nonbusiness saving increases. Of particular interest for our purposes is the fact that increased government spending will, all else being equal, result in higher after-tax profits.
Achieving the industrial transformation necessary to have a green economy will require large government expenditure. All else being equal, this will translate into higher corporate profits without any innovation or gain in productivity required. Because corporate ownership is very unequally distributed, higher corporate profits overwhelmingly benefit the wealthy. Of course, the question of which sectors or specific corporations reap that profit cannot be answered with macroeconomic analysis.
Box 3: Government subsidies for fossil fuels
Calculating the value of Canadian subsidies for the extraction, production, and use of fossil fuels is complex due to the lack of transparency in both government and corporate finances as well as differing definitions and calculation methodologies. As a result, the estimates range greatly. For example, the International Monetary Fund estimates Canada’s fossil fuel subsidies to be $49.4 billion in 2022, including the externalized costs of carbon emissions on health and the environment.[131] The Parliamentary Budget Officer’s estimate put the number closer to $19 billion in 2021, and they make no attempt to put a cost on externalities, but do include important tax breaks and direct investments not explicitly included in the IMF’s estimate.[132] Other estimates do not include big ticket items like Canada’s direct investment in various fossil fuel projects such as the Trans Mountain Pipeline, resulting in significantly lower estimates.[133] However, all estimates conclude that public subsidies for fossil fuels in Canada range in the billions annually.
Box 4: Canada’s tax system
Canada’s tax system has two broad components: 1) the benchmark tax system, and 2) tax expenditures.
The benchmark system has three parts: the tax base, tax rate(s), and tax bracket(s). The tax base is the income subject to taxation. It is determined by the income included and the deductions allowed. Tax rates and tax brackets determine how much of the taxable income is to be remitted to the government based on the level of income. Personal and corporate income taxes have distinct benchmark systems.
The logic of the personal and corporate tax bases is the same, as both are intended to include all income from all sources with some exceptions, the most notable of which is capital gains. However, the ways that taxable income for individuals and corporations gets determined is quite different based on the deductions allowed. The rate and bracket structure are also significantly different. The corporate income tax system has just one bracket with a single rate, while the personal income tax system currently has six brackets. The tax rates and brackets make the benchmark personal income tax system progressive.
Tax expenditures are generally provided on the basis of 1) taxfiler attributes, such as age and marital status, 2) income attributes, such as being from foreign sources, or 3) types of activities, such as paying tuition or investing in low-emission technology. Tax credits, in particular, are offered by governments as a way to encourage certain types of behaviour, such as training in a trade or profession.
Box 5: Depreciation & Capital Cost Allowances (CCAs)
When a corporation makes an investment in productive assets they do not immediately expense the full cost. Instead, they deduct a portion of the cost over an extended period of time. This accounts for the fact that 1) their expenditure gained them a valuable asset, and 2) the value of that asset will likely fall over time due to wear-and-tear and/or obsolescence. The ideal would be for an investment to get deducted as an asset’s value declines. However, this is practically impossible to measure. Instead, companies are allowed to deduct a portion of the investment cost based on estimates of a productive asset’s useful life. Companies report depreciation as part of their financial disclosures. Recorded depreciation is based on accounting rules and is intended to provide shareholders with an accurate picture of a company’s balance sheet. CCAs are claimed based on rates defined by the government for different classes of productive assets.[134] An accelerated CCA provides an increased rate, which allows a company to expense more of an investment each year, which is intended to induce greater investment.
Appendix 1: Sectoral finance comparison, 2010-9
The table below compares the average values of several major financial metrics for twelve of Canada’s biggest non-financial sectors over the pre-pandemic decade. By some of the metrics, oil and gas extraction has been the largest non-financial sector in the country. It has had the largest value of total assets (not shown), fixed assets, and operating profits. The other identifiable fossil fuel sectors—refineries and pipelines—also rank highly in terms of fixed assets and operating profits. Coal is included in mining and quarrying, which ranks third in terms of fixed assets. Pipelines had the largest operating profit margin. Conversely, the fossil fuel sectors all rank near or at the bottom in terms of operating asset turnover rates, which measures the amount of operating revenue per dollar of fixed assets. Among the forty sectors included in the data source, pipelines and oil and gas extraction had the lowest and second lowest asset turnover rates, respectively. The three fossil fuel sectors also rank much lower in terms of labour expenses. Oil and gas extraction has 20% of all fixed assets of the non-financial sectors, but only 2.9% of the labour expenses. If we move from financial values to employment, oil and gas extraction comprises an even smaller share of 0.7%.[135] Refineries have 1.3% of labour expenses and 0.13% of employees. This is evidence of the fact that fossil fuel sectors employ a relatively small portion of Canada’s labour, but the jobs are relatively well paid.
|
Sector |
Fixed assets |
Operating revenue |
Operating expenses |
Labour expenses |
Operating profits |
Profit margin |
Asset turnover |
|
Oil & gas extraction |
$362 |
$145 |
$138 |
$16 |
$26 |
18.2% |
0.40 |
|
Fossil fuel refineries |
$123 |
$133 |
$123 |
$7 |
$11 |
8.1% |
1.08 |
|
Mining & quarrying |
$98 |
$46 |
$43 |
$7 |
$4 |
8.8% |
0.47 |
|
Transportation & delivery |
$92 |
$142 |
$130 |
$32 |
$12 |
8.4% |
1.54 |
|
Utilities |
$77 |
$47 |
$43 |
$2 |
$4 |
8.7% |
0.61 |
|
Agriculture, forestry, fishing & hunting |
$68 |
$66 |
$62 |
$9 |
$4 |
5.5% |
0.96 |
|
Construction |
$67 |
$297 |
$282 |
$72 |
$15 |
5.0% |
4.44 |
|
Tele- communications |
$54 |
$64 |
$52 |
$10 |
$13 |
19.4% |
1.19 |
|
Metals & metal product manufacturing |
$53 |
$110 |
$104 |
$23 |
$6 |
5.8% |
2.09 |
|
Arts & entertainment |
$50 |
$93 |
$90 |
$29 |
$3 |
2.9% |
1.85 |
|
Pipelines |
$50 |
$17 |
$12 |
$1 |
$5 |
30.0% |
0.35 |
|
Total non-financial sectors |
$1,781 |
$3,324 |
$3,149 |
$551 |
$197 |
5.9% |
1.87 |
Note: Values in billions, except for profit margin and asset turnover. Values are annual averages for 2010-19. ‘Profit margin’ is ‘Operating profits’ divided by ‘Operating revenue’. Asset turnover is ‘Operating revenue’ divided by ‘Fixed assets’. ‘Oil and gas extraction’ and ‘mining and quarrying’ both include support activities for the same. StatCan table 33-10-0500-01: Balance sheet, income statement and taxation statistics with selected financial ratios, by non-financial industries.
Appendix 2: Corporate finance comparison, 2000-19
The table below compares the average value of several financial metrics, plus employment, for Canada’s ten most profitable non-financial corporations over the two decades before the pandemic. Fossil fuel companies are seven of the ten most profitable. When ranked by fixed assets instead, these seven companies remain in the top 10. Conversely, when ranked by number of employees, they are found much lower. All seven companies have fewer than 10,000 employees, while among the three non-fossil fuel companies in the top 10, the fewest employees is 23,100. All of the companies have an overall effective tax rate well below the average statutory rate, which was 31.5% over the 20 year window.
|
Company |
Fixed assets |
Total revenue |
Operating expenses |
Pre-tax profits |
Employees |
Profit margin |
Effective tax rate |
|
Bell |
$21.6 |
$20.0 |
$12.2 |
$3.4 |
57,000 |
17.1% |
14.6% |
|
CNR |
$24.6 |
$9.3 |
$5.0 |
$3.1 |
23,100 |
33.8% |
13.9% |
|
Imperial |
$20.0 |
$25.0 |
$21.2 |
$3.1 |
5,600 |
12.5% |
22.8% |
|
Suncor |
$41.6 |
$24.1 |
$17.6 |
$2.9 |
9,300 |
12.1% |
22.4% |
|
Canadian Natural Resources |
$38.6 |
$11.7 |
$5.4 |
$2.5 |
5,400 |
21.7% |
9.2% |
|
TC Energy Corp |
$34.6 |
$9.5 |
$5.0 |
$2.0 |
6,700 |
20.5% |
14.2% |
|
Magna International |
$6.4 |
$31.9 |
$29.1 |
$1.9 |
107,800 |
5.8% |
26.4% |
|
Husky Energy |
$20.5 |
$15.7 |
$12.1 |
$1.6 |
4,640 |
10.1% |
20.4% |
|
Teck Resources |
$17.5 |
$7.3 |
$4.8 |
$1.5 |
8,800 |
20.9% |
26.3% |
|
Enbridge |
$34.5 |
$21.1 |
$17.4 |
$1.5 |
8,000 |
7.2% |
11.3% |
Note: Based on analysis of Compustat database. Values in billions, except employees, which is in number of employees, rounded to the nearest 100.
Endnotes
[1] Department of Finance. 2023. “2023 Budget Plan.” Government of Canada, p. 71. https://www.budget.canada.ca/2023/home-accueil-en.html.
[2] Environment and Climate Change Canada. 2022. “2030 Emissions Reduction Plan: Canada’s Next Steps for Clean Air and a Strong Economy.” Government of Canada. https://publications.gc.ca/collections/collection_2022/eccc/En4-460-2022-eng.pdf.
[3] Canadian Climate Institute. 2022. “Damage Control: Reducing the Costs of Climate Impacts in Canada.” https://climateinstitute.ca/wp-content/uploads/2022/09/Damage-Control_-EN_0927.pdf.
[4] Lee, Marc, Caroline Brouillette, and Hadrian Mertins-Kirkwood. 2023. “Spending What It Takes: Transformational Climate Investments for Long-Term Prosperity in Canada.” Canadian Centre for Policy Alternatives and Climate Action Network Canada. https://climateactionnetwork.ca/wp-content/uploads/Spending-What-It-Takes.pdf; Green Budget Coalition. 2022. “Recommendations for Budget 2023.” https://greenbudget.ca/wp-content/uploads/sites/5/2022/10/Green-Budget-Coalitions-Recommendations-for-Budget-2023-October-6-2022.pdf; Royal Bank of Canada. 2021. “The $2 Trillion Transition: Canada’s Road to Net Zero.” https://thoughtleadership.rbc.com/the-2-trillion-transition/; Green Economy Network. n.d. “The Change We Need: Ten Policies for a Green Economy.” Accessed June 23, 2023. https://greeneconomynet.ca/wp-content/uploads/2020/03/The-Change-We-Need.pdf.
[5] Annual values are adjusted for their relative economic magnitude as measured by share of GDP using GDP for 2022. Historical government spending: 1926-60: StatCan table 36-10-0177-01 Archived - Historical: Government sector revenue and expenditure, annual, 1968 System of National Accounts (SNA), annual, 1926 - 1986; 1961-2022: StatCan table 36-10-0477-01: Canadian government finance statistics for the federal government; Historical GDP: 1926-60: StatCan table 36-10-0202-01: Archived - Historical: Gross domestic product (GDP) at 1981 prices, expenditure-based, 1968 System of National Accounts (SNA), annual, 1926 - 1986; 1961-2022: StatCan table 36-10-0104-01: Gross domestic product, expenditure-based, quarterly; Projected government spending and GDP: Budget Plan 2023.
[6] When possible, we pulled out the public portion of estimates for different spending areas provided in the RBC report.
[7] Mazzucato, Mariana. 2021. Mission Economy: A Moonshot Guide to Changing Capitalism. New York: Penguin Books Limited.
[8] Department of Finance. 2022. “2022 Budget Plan.” Government of Canada, p. 60. https://www.budget.canada.ca/2022/home-accueil-en.html.
[9] Meredith, Tyler, and Alan Broadbent. 2023. “Building Housing Like We Did the St. Lawrence Seaway.” Air Quotes Media. https://www.airquotesmedia.com/quotes/building-housing-like-we-did-the-st-lawrence-seaway-18aug2023
[10] Royal Commission on Taxation. 1966. Report of the Royal Commission on Taxation, Vols. 1-6. Ottawa: Crown Copyrights. https://bit.ly/3ogjFky.
[11] ibid, Vol. 1, p. 5.
[12] Avi-Yonah, Reuven S. 2006. “The Three Goals of Taxation.” Tax Law Review 60 (1): 29–56.
[13] “Fiscal Multipliers and Fiscal Sensitivities.” 2021. Government of Canada. Office of the Parliamentary Budget Officer. https://www.pbo-dpb.ca/en/additional-analyses--analyses-complementaires/BLOG-2021-013--fiscal-multipliers-fiscal-sensitivities--multiplicateurs-budgetaires-sensibilites-perspectives-financieres; Deleidi, Matteo, Francesca Iafrate, and Enrico Sergio Levrero. 2020. “Public Investment Fiscal Multipliers: An Empirical Assessment for European Countries.” Structural Change and Economic Dynamics 52 (March): 354–65. https://doi.org/10.1016/j.strueco.2019.12.004; Batini, Nicoletta, Luc Eyraud, Lorenzo Forni, and Anke Weber. 2014. “Fiscal Multipliers: Size, Determinants, and Use in Macroeconomic Projections.” Washington, DC: International Monetary Fund. https://elibrary.imf.org/openurl?genre=journal&issn=2075-8669&volume=2014&issue=004.
[14] Canadian Broadcasting Corporation. 2020. “The Big Spend”. https://newsinteractives.cbc.ca/features/2020/thebigspend/
[15] StatCan table 11-10-0135-01: Low income statistics by age, sex and economic family type.
[16] Cochrane, DT. 2023. “Corporate Profits are at Record Highs”. Canadians for Tax Fairness. https://www.taxfairness.ca/en/resources/news-views/corporate-profits-ar…
[17] Based on data from Compustat. Corporations ranked by market capitalization. Distribution to shareholders combines dividend payments and share buybacks.
[18] Values average each group’s share of market income, including capital gains, for 1982-1989 and 2010-19. StatCan table 11-10-0055-01: High income tax filers in Canada.
[19] It must be noted that the wealth measure is based on net worth (assets minus liabilities), which under-represents the wealth actually controlled by those at the top of the wealth distribution. If one person has total assets of $100,000 and total liabilities of $50,000, then they have net wealth of $50,000. If another person has total assets of $1 billion and total liabilities of $1 billion, then they have net wealth of $0. But which of these people actually has more economic power?
[20] Data on wealth and income for Canadian quantiles comes from the World Inequality Database (wid.com) retrieved September 27, 2023.
[21] Streeter, Jialu L. 2022. “How Do Tax Policies Affect Individuals and Businesses?” Stanford Institute for Economic Policy Research. https://siepr.stanford.edu/publications/policy-brief/how-do-tax-policies-affect-individuals-and-businesses; Arcila, Andres, and John D. Baker. 2022. “Evaluating Carbon Tax Policy: A Methodological Reassessment of a Natural Experiment.” Energy Economics 111 (July): 106053; Pretis, Felix. 2022. “Does a Carbon Tax Reduce CO2 Emissions? Evidence from British Columbia.” Environmental and Resource Economics 83 (1): 115–44.
[22] Ewald, Jens, Thomas Sterner, and Erik Sterner. 2022. “Understanding the Resistance to Carbon Taxes: Drivers and Barriers among the General Public and Fuel-Tax Protesters.” Resource and Energy Economics 70 (November): 101331. https://doi.org/10.1016/j.reseneeco.2022.101331; Mildenberger, Matto, Erick Lachapelle, Kathryn Harrison, and Isabelle Stadelmann-Steffen. 2022. “Limited Impacts of Carbon Tax Rebate Programmes on Public Support for Carbon Pricing.” Nature Climate Change 12 (2): 141–47. https://doi.org/10.1038/s41558-021-01268-3; Carattini, Stefano, Maria Carvalho, and Sam Fankhauser. 2018. “Overcoming Public Resistance to Carbon Taxes.” Wiley Interdisciplinary Reviews. Climate Change 9 (5): e531. https://doi.org/10.1002/wcc.531.
[23] Chancel, Lucas, Philipp Bothe, and Tancrède Voituriez. 2023. “Climate Inequality Report 2023: Fair Taxes for a Sustainable Future in the Global South.” World Inequality Lab. https://wid.world/document/climate-inequality-report-2023/.
[24] Cozzi, Laura, Olivia Chen, and Hyeji Kim. 2023. “The World’s Top 1% of Emitters Produce over 1000 Times More CO2 than the Bottom 1%.” International Energy Agency. February 22, 2023. https://www.iea.org/commentaries/the-world-s-top-1-of-emitters-produce-…; Kartha, Sivan, Eric Kemp-Benedict, Emily Ghosh, Anna Nazareth, and Tim Gore. 2020. “The Carbon Inequality Era: An Assessment of the Global Distribution of Consumption Emissions among Individuals from 1990 to 2015 and Beyond.” Oxfam and Stockholm Environment Institute. https://doi.org/10.21201/2020.6492.
[25] Data from Kartha, Sivan, Eric Kemp-Benedict, Emily Ghosh, Anna Nazareth, and Tim Gore. 2020. “The Carbon Inequality Era: An Assessment of the Global Distribution of Consumption Emissions among Individuals from 1990 to 2015 and Beyond.” Oxfam and Stockholm Environment Institute. https://doi.org/10.21201/2020.6492.
[26] Chancel, Lucas, Thomas Piketty, Emmanuel Saez, and Gabriel Zucman. 2021. “World Inequality Report 2022.” World Inequality Lab. https://wir2022.wid.world/.
[27] Data from World Inequality Database (wid.com) retrieved August 29, 2023.
[28] Based on analysis of the Compustat North American database for companies identified as NAICS 2111: Oil and gas extraction, NAICS 2121: Coal mining, NAICS 2212: Natural gas distribution, NAICS 3241: Petroleum and coal products manufacturing, NAICS 4247: Petroleum and petroleum products merchant wholesalers, NAICS 4861: Pipeline transportation of crude oil, NAICS 4862: Pipeline transportation of natural gas, NAICS 486910: Pipeline transportation of refined petroleum products. We excluded retailers that sell fossil fuel products, including gas stations (NAICS 4571).
[29] Supran, G., S. Rahmstorf, and N. Oreskes. 2023. “Assessing ExxonMobil’s Global Warming Projections.” Science 379 (6628). https://www.science.org/doi/10.1126/science.abk0063.
[30] Laville, Sandra. 2019. “Top Oil Firms Spending Millions Lobbying to Block Climate Change Policies, Says Report.” The Guardian, March 22, 2019. https://www.theguardian.com/business/2019/mar/22/top-oil-firms-spending-millions-lobbying-to-block-climate-change-policies-says-report.
[31] The wealthiest 10% of Canadian families hold 84% of all equities and 61% of other financial assets (excluding pensions). Data from the United States, which shows a similar proportion for the top 10%, reveals that the Top 1% own 38% of all equities. Canada: StatCan table 11-10-0075-01: Selected assets and debts by net worth deciles, Survey of Financial Security. United States: Gebeloff, Robert. 2021. “Who Owns Stocks? Explaining the Rise in Inequality During the Pandemic.” The New York Times, January 26, 2021. https://www.nytimes.com/2021/01/26/upshot/stocks-pandemic-inequality.html.
[32] Stand.Earth. 2020. “Who benefits? An investigation of foreign ownership in the oil sands.” https://stand.earth/wp-content/uploads/2022/10/report-foreign-ownership…
[33] For example, recovering from the 2022 flooding in British Columbia will cost an estimated $9 billion. Hunter, Justine. 2022. “Cost of Rebuilding B.C. after Flooding Nears $9-Billion.” The Globe and Mail, February 19, 2022. https://www.theglobeandmail.com/canada/british-columbia/article-cost-of-rebuilding-bc-after-november-storms-nears-9-billion/.
[34] StatCan table 33-10-0500-01: Balance sheet, income statement and taxation statistics with selected financial ratios, by non-financial industries. Profits are ‘operating profit or loss’. Revenue is ‘total operating revenue’.
[35] GDP measures the value of final goods and services, while total corporate revenue includes the sales of intermediate goods and services, which allows the latter to exceed the former. 1965-87: StatCan table 33-10-0016-01: Archived - Corporation taxation statistics, by major industry group; 1988-98: StatCan table 33-10-0011-01: Archived - Financial and taxation statistics for enterprises, by industry based on the Standard Industrial Classification for Companies and Enterprises 1980; 1999-2009: 33-10-0006-01: Archived - Financial and taxation statistics for enterprises, by industry type, inactive; 2010-1: 33-10-0498-01: Balance sheet, income statement and taxation statistics with selected financial ratios, by total all industries.
[36] Cochrane, DT. 2022. “The Rise of Corporate Profits in the Time of Covid.” Canadians for Tax Fairness. https://www.taxfairness.ca/en/resources/reports/report-rise-corporate-profits-time-covid.
[37] Values are the total emissions for 2010-9. StatCan table 38-10-0097-01: Physical flow account for greenhouse gas emissions.
[38] Based on analysis of data from Compustat.
[39] The Big 5 Banks are TD, RBC, Scotiabank, Bank of Montreal, and CIBC. ‘Fossil-Power Top 50’. 2019. Corporate Mapping Project. https://www.corporatemapping.ca/wp-content/uploads/2019/07/Fossil-Power_Top50.pdf.
[40] Smith, L. 2022. “How Canada’s Oil Sands ‘Bankrolled the Assault on Truth.” DeSmog. https://www.desmog.com/2022/09/20/petroleum-papers-geoff-dembicki-oil-sands-canada-exxon-imperial-syncrude-climate-denial/; Influence Map. 2023. “The Canadian Oil and Gas Industry and Climate Policy.” https://lobbymap.org/site//data/000/021/Canada_Report_-_Main_Briefing_Feb21st_2022.pdf.
[41] StatCan table 11-10-0055-01: High income tax filers in Canada.
[42] Macdonald, David. 2016. “Out of the Shadows: Shining a Light on Canada’s Unequal Distribution of Federal Tax Expenditures.” Ottawa, CA: Canadian Centre for Policy Alternatives. https://policyalternatives.ca/sites/default/files/uploads/publications/National%20Office/2016/11/Out_of_the_Shadows.pdf.
[43] In the CRA T1 tables, these are referred to as ‘personal amounts’, although the reported value includes the basic personal amount, which is actually part of the benchmark system. They include a few other credits beyond those listed. For more on the distinction between income tax expenditures and the benchmark tax system see Box 4.
[44] Incomes over $100,000 were 9.5% of all taxfilers in 2019. Those with incomes over $250,000 were 1.2% of all taxfilers.
[45] This is calculated from the total dividends declared by fossil fuel sectors and the share of the dividends of non-financial corporations going to Canadians. StatCan table 36-10-0117-01: Undistributed corporation profits.
[46] Fix, Blair. 2017. “Energy and Institution Size.” PLOS ONE 12 (2): e0171823. https://doi.org/10.1371/journal.pone.0171823.
[47] Fix, Blair. 2019. “Energy, Hierarchy and the Origin of Inequality.” PLOS ONE 14 (4): e0215692. https://doi.org/10.1371/journal.pone.0215692.
[48] Giroux, Yves. 2021. “Energy Sector and Agriculture: Federal Revenue Foregone from Tax Provisions.” Ottawa, CA: Parliamentary Budget Office. https://www.pbo-dpb.ca/en/publications/RP-2122-022-M--energy-sector-agriculture-federal-revenue-forgone-from-tax-provisions--secteur-energie-agriculture-recettes-auxquelles-renonce-gouvernement-federal-titre-certaines-disposi.
[49] CCAs: StatCan table 33-10-0500-01: Balance sheet, income statement and taxation statistics with selected financial ratios, by non-financial industries; Prior year losses: StatCan table 33-10-0006-01: Archived - Financial and taxation statistics for enterprises, by industry type, inactive.
[50] ‘Prior year losses’ are unavailable for pipelines due to the sector being included with warehousing and transportation support in the data source used.
[51] Department of Finance. 2023. “Report on Federal Tax Expenditures: Concepts, Estimates and Evaluations.” Ottawa, ON: Government of Canada. https://www.canada.ca/content/dam/fin/publications/taxexp-depfisc/2023/taxexp-depfisc-23-eng.pdf.
[52] Kerr, William R., William F. Lincoln, and Prachi Mishra. 2014. “The Dynamics of Firm Lobbying.” American Economic Journal: Economic Policy 6 (4): 343–79. https://doi.org/10.1257/pol.6.4.343.
[53] Hager, Sandy Brian, and Joseph Baines. 2020. “The Tax Advantage of Big Business: How the Structure of Corporate Taxation Fuels Concentration and Inequality.” Politics & Society 48 (2): 275–305. https://doi.org/10.1177/0032329220911778.
[54] Relationship between firm size, cash holdings, advertising, and profits based on analysis of North American firms included in the Compustat database of publicly listed companies. Firm size was assessed using number of employees, total assets, and total sales.
[55] Based on analysis of the earnings before interest, depreciation, and amortization (EBITDA) of publicly-listed, non-financial corporations using the Compustat database.
[56] Cochrane, DT. 2022. “Report: January 7th is Corporate Income Tax Freedom Day 2022”. Canadians for Tax Fairness. https://www.taxfairness.ca/en/resources/reports/report-january-7th-corp…
[57] This analysis primarily relies on the values from StatCan table 33-10-0498-01, while also drawing on the federal tax expenditure reports. The former offers a less detailed breakdown of corporate tax expenditures, while the latter does not provide a sectoral breakdown.
[58] McDowall, Will. 2021. “R&D Tax Credits Can Be a Significant Source of Taxpayer Support for Fossil Fuel Innovation.” Environmental Research Letters 16 (6): 064061. https://doi.org/10.1088/1748-9326/ac0379; https://www.pembina.org/reports/waiting-to-launch-2022-09-23.pdf.
[59] Values sum annual credits claimed by each sector. StatCan table 33-10-0498-01. Note that data is unavailable for pipelines for 2020.
[60] StatCan table 33-10-0498-01.
[61] Cochrane, DT. 2023. “Public Funds for Private Gains: Canada’s Most Profitable Corporations Received Pandemic Subsidies While Avoiding Billions in Taxes.” Canadians for Tax Fairness. https://www.taxfairness.ca/en/resources/reports/public-funds-private-gains.
[62] Department of Finance. 2021. “2021 Budget Plan.” Government of Canada, p. 480. https://www.budget.canada.ca/2021/pdf/budget-2021-en.pdf.
[63] Department of Finance. 2023. “2023 Budget Plan.” Government of Canada. https://www.budget.canada.ca/2023/pdf/budget-2023-en.pdf.
[64] Based on an analysis of budget speeches and tabled budget plans going back to 1980.
[65] Department of Finance. 1998. “1998 Budget Plan.” Government of Canada., p. 117. https://www.budget.canada.ca/pdfarch/budget98/bp/bp98e.pdf.
[66] Department of Finance. 1999. “1999 Budget Plan.” Government of Canada., p. 215-6.
[67] StatCan table 33-10-0011-01: Archived - Financial and taxation statistics for enterprises, by industry based on the Standard Industrial Classification for Companies and Enterprises 1980 (SIC-C).
[68] StatCan table 38-10-0111-01: Archived - Greenhouse gas emissions, by sector; “Report of the Individual Review of the Annual Submission of Canada Submitted in 2010.” 2011. Framework Convention on Climate Change. United Nations. https://unfccc.int/resource/docs/2011/arr/can.pdf.
[69] Government of Alberta. 2008. “Alberta’s Oil Sands: Resourceful. Responsible.” Edmonton, AB. https://open.alberta.ca/dataset/8c6d61b3-94e1-4940-b455-9451b05e507b/resource/3e25f3ae-016c-49de-8394-853bbee4174f/download/aenv-albertas-oil-sands-resourceful-responsible-7925.pdf; Canadian Association of Petroleum Producers. 2022. “Advancing Economic Recovery While Improving Environmental Performance: Strategic Investment and Job Creation: 2022 Pre-Budget Consultation Submission Standing Committee on Finance (FINA).” https://www.ourcommons.ca/Content/Committee/441/FINA/Brief/BR11533264/br-external/CanadianAssociationOfPetroleumProducers-e.pdf.
[70] Carter, Angela, and Laura Cameron. 2023. “Why Carbon Capture and Storage Is Not a Net-Zero Solution for Canada’s Oil and Gas Sector.” International Institute for Sustainable Development. https://www.iisd.org/articles/deep-dive/carbon-capture-not-net-zero-solution; Jacobson, Mark Z. 2019. “The Health and Climate Impacts of Carbon Capture and Direct Air Capture.” Energy & Environmental Science 12 (12): 3567–74. https://doi.org/10.1039/C9EE02709B.
[71] Environment and Climate Change Canada. 2018. “How Carbon Pricing Works.” Government of Canada. October 23, 2018. https://www.canada.ca/en/environment-climate-change/services/climate-change/pricing-pollution-how-it-will-work/putting-price-on-carbon-pollution.html.
[72]The Canadian Climate Institute. 2020. “Expert Assessment of Climate Pricing Systems”. Environment and Climate Change Canada. https://climateinstitute.ca/reports/the-state-of-carbon-pricing-in-cana…
[73] Environment and Climate Change Canada. 2022. “Options to Cap and Cut Oil and Gas Sector Greenhouse Gas Emissions to Achieve 2030 Goals and Net-Zero by 2050.” Government of Canada. https://www.canada.ca/content/dam/eccc/documents/pdf/climate-change/oil-gas-emissions-cap/Oil%20and%20Gas%20Emissions%20Cap%20Discussion%20Document%20-%20July%2018%202022_EN.pdf; Environmental Defence, and Climate Action Network. 2022. “Why We Need a Robust and Ambitious Cap on Emissions from the Oil and Gas Sector.” https://environmentaldefence.ca/wp-content/uploads/2022/06/Oil-and-Gas-Emissions-Cap-Backgrounder-Sept-06.pdf; Forman, Jared, Jason Dion, Dale Beugin, and Rick Smith. 2022. “Aligning Canada’s Oil and Gas Sector with Net Zero.” Canadian Climate Institute. https://climateinstitute.ca/wp-content/uploads/2022/09/Aligning-Oil-Gas-with-net-zero.pdf.
[74] Beugin, Dale. 2023. “What Are Contracts for Difference?” Canadian Climate Institute. https://climateinstitute.ca/what-are-contracts-for-difference/; Potkins, Meghan. 2023. “What Are ‘carbon Contracts for Difference’ and Why Do They Matter?” Financial Post. https://financialpost.com/commodities/energy/oil-gas/federal-budget-offers-contracts-green-investment.
[75] Environment and Natural Resources. 2023. “Inefficient Fossil Fuel Subsidies: Government of Canada Self-Review Assessment Framework.” Government of Canada. https://www.canada.ca/en/services/environment/weather/climatechange/climate-plan/inefficient-fossil-fuel-subsidies/assessment-framework.html.
[76] Department of Finance. 2021. “2021 Budget Plan.” Government of Canada, p. 168. https://www.budget.canada.ca/2021/pdf/budget-2021-en.pdf.
[77] The critical mineral exploration tax credit benefits holders of flow-through shares. However, it is still intended to spur business activity, specifically exploration of specific minerals, by enticing investors to put more money into the highly speculative junior mining sector..
[78] https://www.imf.org/en/Publications/fandd/issues/2019/06/what-is-carbon-taxation-basics
[79] Ammar, Nasreddine, Marianne Laurin, and Diarra Sourang. 2023. “A Distributional Analysis of the Federal Fuel Charge under the 2030 Emissions Reduction Plan.” Office of the Parliamentary Budget Officer. Ottawa, ON: Parliamentary Budget Office. https://www.pbo-dpb.ca/en/publications/RP-2223-028-S--distributional-analysis-federal-fuel-charge-under-2030-emissions-reduction-plan--analyse-distributive-redevance-federale-combustibles-dans-cadre-plan-reduction-emissions-2030.
[80] Ammar, Nasreddine, Marianne Laurin, and Diarra Sourang. 2023. “A Distributional Analysis of the Federal Fuel Charge under the 2030 Emissions Reduction Plan.” Office of the Parliamentary Budget Officer. Ottawa, ON: Parliamentary Budget Office. https://www.pbo-dpb.ca/en/publications/RP-2223-028-S--distributional-analysis-federal-fuel-charge-under-2030-emissions-reduction-plan--analyse-distributive-redevance-federale-combustibles-dans-cadre-plan-reduction-emissions-2030; Winter, Jennifer, Brett Dolter, and G. Kent Fellows. 2023. “Carbon Pricing Costs for Households and the Progressivity of Revenue Recycling Options in Canada.” Canadian Public Policy 49 (1): 13–45.
[81] Gignac, Renaud, and Dave Sawyer. 2021. “Canada’s Carbon Pricing Update Improves Certainty, but Neglects Industrial Emissions.” Canadian Climate Institute. August 12, 2021. https://climateinstitute.ca/canadas-carbon-pricing-update/.
[82] Gignac and Sawyer, op.cit.
[83] Bernstein, Michael, Dale Beugin, and Nicholas Rivers. 2023. “Implementing Carbon Contracts for Difference (CCfD): Part 1.” Canadian Climate Institute. https://climateinstitute.ca/why-uncertainty-value-carbon-credits-policy-problem/.
[84] Through 2019. Based on StatCan table 33-10-0498-01. The biggest beneficiary of generous CCAs was the automobile manufacturing sector.
[85] Calculated by multiplying each sector’s effective tax rate (total taxes divided by the tax base) by the reduction in taxable income from the excessive CCAs.
[86] StatCan table 38-10-0098-01: Direct plus indirect energy and greenhouse gas emissions intensity, by industry.
[87] Based on total industries less ‘oil and gas extraction’, ‘coal mining’, and ‘petroleum and coal product manufacturing’.
[88] ‘Support activities’ includes support activities for mining. StatCan table 38-10-0098-01: Direct plus indirect energy and greenhouse gas emissions intensity, by industry; StatCan table 38-10-0097-01: Physical flow account for greenhouse gas emissions.
[89] Labour conditions will be included in the Clean Technology Investment, Clean Hydrogen, and Clean Electricity tax credits, and added to the CCUS tax credit. Department of Finance. 2023. “Tax Measures: Supplementary Information.” Government of Canada.
[90] Chirag, Lala. 2023. “Direct Pay: An Uncapped Promise of the Inflation Reduction Act.” Brooklyn, NY: Center for Public Enterprise. https://www.publicenterprise.org/reports/direct-pay-uncapped-ira.
[91] Miller, Katrina. 2023. “Tax Credits: A Multi-Billion-Dollar Gamble on Industry with No Guarantee of Just Transition | Canadians for Tax Fairness.” Canadians for Tax Fairness. https://www.taxfairness.ca/en/resources/news-views/tax-credits-multi-billion-dollar-gamble-industry-no-guarantee-just-transition.
[92] Department of Finance. 2022. “2022 Budget Impacts Report on Gender, Diversity, and Quality of Life.” Government of Canada. https://budget.canada.ca/2022/pdf/gdql-egdqv-2022-en.pdf; Department of Finance. 2023. “2023 Budget Impacts Report on Gender, Equality, Diversity and Quality of Life.” Government of Canada. https://www.budget.canada.ca/2023/pdf/budget-gdql-egdqv-2023-en.pdf.
[93] Hoicka, Christina E, Matthew Paterson, Angela Carter, Jason MacLean, Emily Eaton, et. al. 2022. “Letter from Scientists, Academics, and Energy System Modellers: Prevent Proposed CCUS Investment Tax Credit from Becoming a Fossil Fuel Subsidy,” October 14, 2016. https://www.science.org/doi/10.1126/science.aah4567.
[94] Clifford, Catherine. 2021. “Carbon Capture Technology Has Been around for Decades — Here’s Why It Hasn’t Taken Off.” CNBC. January 31, 2021. https://www.cnbc.com/2021/01/31/carbon-capture-technology.html.
[95] Mazzucato. 2021; Naran, Baysa, Jake Connolly, Paul Rosane, Dharshan Wignarajah, and Githungo Wakaba. 2022. “Global Landscape of Climate Finance: A Decade of Data.” Climate Policy Initiative. https://www.climatepolicyinitiative.org/publication/global-landscape-of-climate-finance-a-decade-of-data/.
[96] Net-Zero Advisory Body. 2023. “Compete and Succeed in a Net Zero Future.” https://nzab2050.ca/publications/news_feed/net-zero-advisory-body-s-annual-report,
[97] Mazzucato, Mariana. 2014. The Entrepreneurial State : Debunking Public vs Private Sector Myths. London: Anthem Press; Mazzucato, Mariana, and Rosie Collington. 2023. The Big Con: How the Consulting Industry Weakens Our Businesses, Infantilizes Our Governments, and Warps Our Economies. New York: Penguin Press.
[98] United Nations Development Programme. 2022. “Global Climate Public Finance Review 2022.” United Nations. https://www.undp.org/sites/g/files/zskgke326/files/2022-09/UNDP-Global-Climate-Public-Finance-Review-2022.pdf; Naran, Baysa, Jake Connolly, Paul Rosane, Dharshan Wignarajah, and Githungo Wakaba. 2022. “Global Landscape of Climate Finance: A Decade of Data.” Climate Policy Initiative. https://www.climatepolicyinitiative.org/publication/global-landscape-of-climate-finance-a-decade-of-data/.
[99] Estimated values are for 2022 through 2031. All values are in Canadian dollars based on a CAD/USD exchange rate of $0.75. McKinsey & Company. 2022. “What’s in the Inflation Reduction Act (IRA) of 2022.” https://www.mckinsey.com/industries/public-sector/our-insights/the-inflation-reduction-act-heres-whats-in-it.
[100] Based on estimated revenue from tax measures announced in Budget 2022, Fall Economic Statement 2022, and Budget 2023. Excludes revenue from changes to international accounting standards and promised spending on the Canada Revenue Agency announced with Budget 2022. The latter exclusion follows from the Parliamentary Budget Officer’s assessment that previous additional funding for the CRA has barely kept up with inflation. Bernier, Govindadeva, and Régine Cléophat. 2022. “International Comparison of the Canada Revenue Agency’s Performance.” Office of the Parliamentary Budget Officer. Ottawa, ON: Parliamentary Budget Office. https://www.pbo-dpb.ca/en/publications/RP-2122-036-S--international-comparison-canada-revenue-agency-performance--comparaison-internationale-rendement-agence-revenu-canada.
[101] G7 Panel on Economic Resilience. 2021. “Global Economic Resilience: Building Forward Better.” G7. https://rooseveltinstitute.org/wp-content/uploads/2022/09/GlobalEconomic-ResilienceBuilding-ForwardBetter_202110.pdf.
[102] Ibid., p. 30.
[103] European Commission. 2019. “Communication from the Commission to the European Parliament, the European Council, the Council, the European Economic and Social Committee and the Committee of the Regions: The European Green Deal.” Brussels, BE: European Union, p. 17. https://eur-lex.europa.eu/legal-content/EN/TXT/?qid=1588580774040&uri=CELEX%3A52019DC0640.
[104] KPMG. 2021. “Energy Taxation Directive.” https://kpmg.com/xx/en/home/insights/2021/08/energy-taxation-directive.html; Transport & Environment. 2020. “The Energy Taxation Directive: T&E’s Feedback on the Inception Impact Assessment.” https://www.transportenvironment.org/wp-content/uploads/2021/07/2020_04_TransportEnvironment-feedback-EnergyTaxationDirective-IIA-2020.pdf.
[105] Ibid.
[106] “Carbon Border Adjustment Mechanism.” n.d. European Commission. Accessed June 22, 2023. https://taxation-customs.ec.europa.eu/carbon-border-adjustment-mechanism_en.
[107] “Plastic Tax.” 2022. KPMG. July 7, 2022. https://kpmg.com/xx/en/home/insights/2021/09/plastic-tax.html.
[108] Directorate-General for Taxation and Customs Union. 2021. “Taxation in Support of Green Transition: An Overview and Assessment of Existing Tax Practices to Reduce Greenhouse Gas Emissions.” Brussels, BE: Publications Office of the European Union, p. 51. https://data.europa.eu/doi/10.2778/343194.
[109] The windfall tax was recommended by the European Commission in conjunction with a recommended 100% tax on revenues from energy generation above a set cap. Nicolay, Katharina, Daniela Steinbrenner, Nikolas Woelfing, and Julia Spix. 2023. “The Effectiveness and Distributional Consequences of Excess Profit Taxes or Windfall Taxes in Light of the Commission’s Recommendation to Member States.” Brussels, BE: European Parliament. https://www.europarl.europa.eu/RegData/etudes/STUD/2023/740076/IPOL_STU(2023)740076_EN.pdf.
[110] Korea also offers an enhanced R&D tax credit for numerous specific technologies, including those for environmental innovation. Working Party of National Experts on Science and Technology Indicators. 2023. “OECD R&D Tax Incentives Database, 2022 Edition.” Paris: OECD. https://one.oecd.org/document/DSTI/STP/NESTI(2023)2/FINAL/en/pdf.
[111] The European Commission study cited the example of such a combination used in Israel. Ibid., p. 105-6.
[112] Cuff, Madeleine. 2023. “Carbon Tax on Luxuries Is Fairer Way to Cut Emissions, Finds Analysis.” New Scientist. July 11, 2023. https://www.newscientist.com/article/2381923-carbon-tax-on-luxuries-is-….
[113] Oswald, Yannick, Joel Millward-Hopkins, Julia K. Steinberger, Anne Owen, and Diana Ivanova. 2023. “Luxury-Focused Carbon Taxation Improves Fairness of Climate Policy.” One Earth 6 (7): 884–98. https://doi.org/10.1016/j.oneear.2023.05.027.
[114] Zheng, Sola. 2023. “There Needs to Be a Climate Tax for Frequent Fliers.” Time. May 4, 2023. https://time.com/6274716/climate-tax-frequent-fliers/.
[115] Mazzucato, 2014; MacKenzie, Donald, Fabian Muniesa, and Lucia Siu, eds. 2007. Do Economists Make Markets? On the Performativity of Economics. Princeton, NJ: Princeton University Press; Murphy, Liam B., and Thomas Nagel. 2002. The Myth of Ownership: Taxes and Justice. Oxford: Oxford University Press; Polanyi, Karl. (1944) 2001. The Great Transformation: The Political and Economic Origins of Our Time. Boston: Beacon Press.
[116] “Tax The Rich.” n.d. Broadbent Institute. Accessed September 8, 2023. https://www.broadbentinstitute.ca/tax_the_rich.
[117] This estimate comes from a 1% tax on fortunes above $10 million, 2% above $100 million, and 3% above $1 billion. Hemingway, Alex. 2023. “Why Canada Still Needs a Wealth Tax—and What It Could Fund.” Policy Note. May 9, 2023. https://www.policynote.ca/wealth-tax-2/; Giroux, Yves. 2021. “Estimating the Top Tail of the Family Wealth Distribution in Canada: Updates and Trends.” Ottawa: Parliamentary Budget Office.
[118] Since 2020, for every dollar of new investment in R&D or productive assets, more than three dollars are going toward financing mergers and acquisitions. StatCan table 36-10-0642-01: New issuances of securities by type of use of proceeds and by industry, monthly.
[119] Klein, Seth. 2020. A Good War: Mobilizing Canada for the Climate Emergency. Toronto: ECW Press.
[120] Levin, Julia. 2023. “Statement on the Government of Canada’s New Policy Ending Subsidies to the Fossil Fuel Industry.” Environmental Defence. July 24, 2023. https://environmentaldefence.ca/2023/07/24/statement-on-government-of-canada-new-policy-ending-subsidies-to-the-fossil-fuel-industry/.
[121] Much of the credit for popularizing this understanding goes to adherents of Modern Monetary Theory (MMT). See Kelton, S. 2020. The Deficit Myth: Modern Monetary Theory and the Birth of the People’s Economy. New York: PublicAffairs; Romanchuk, Brian. 2016. Understanding Government Finance. Montreal: BondEconomics.com; Wray, L. Randall. 2015. Modern Money Theory: A Primer on Macroeconomics for Sovereign Monetary Systems. Palgrave Macmillan UK.
[122] Stuckey, Brett, Becky Becklumb, and Mathieu Frigon. 2021. “How the Bank of Canada Creates Money Through Its Asset Purchases.” Library of Parliament. https://lop.parl.ca/sites/PublicWebsite/default/en_CA/ResearchPublications/201551E.
[123] MMT proponents often cite a 1946 article by Beardsley Ruml, then-Chairman of the Federal Reserve Bank of New York, titled “Taxes for Revenue Are Obsolete”. https://modernmoneynetwork.org/sites/default/files/biblio/BeardsleyRuml.pdf.
[124] Royal Commission on Taxation. op.cit. Vol. 2, p. 1.
[125] Tillotson, Shirley. 2017. Give and Take: The Citizen-Taxpayer and the Rise of Canadian Democracy. Vancouver: UBC Press.
[126] For the debates on money see Ingham, Geoffrey K. 2004. The Nature of Money. Cambridge, UK ; Malden, MA: Polity.
[127] https://www.etymonline.com/word/revenue#etymonline_v_12979.
[128] Kelton, op.cit.
[129] The previous high, in 2018, was $357 billion. StatCan table 33-10-0498-01: Balance sheet, income statement and taxation statistics with selected financial ratios, by total all industries; see Cochrane, DT. 2023. “Corporate Profits Are at Record Highs.” Canadians for Tax Fairness. https://www.taxfairness.ca/en/resources/news-views/corporate-profits-are-record-highs.
[130] This analysis is based on a framework from Levy, David A, Martin P Farnham, and Samira Rajan. 2008. “Where Profits Come From: Answering the Critical Question That Few Ever Ask.” The Jerome Levy Forecasting Center. https://www.levyforecast.com/assets/Profits.pdf.
[131] US Dollar amounts changed to CAN Dollar amounts using an exchange rate of $1.30, the average rate of exchange for 2022. Black, Simon, Antung Liu, Ian Parry, and Nate Vernon, 2023. “IMF Fossil Fuel Subsidies Data: 2023 Update.” Working paper, IMF, Washngton, DC. U.S.
[132] Parlimentary Budget Officer. 2023. “Update on the energy sector and agriculture: federal revenue forgone from tax provisions.” Office of the Parliamentary Budget Officer, Ottawa, Canada. https://www.pbo-dpb.ca/en/publications/RP-2324-007-S--update-energy-sec…
[133] Boisseau-Bouvier, Émile, and Laura Cameron. 2022 “Identifying Inefficient Fossil Fuel Subsidies in Canada”. International Institute for Sustainable Development. https://www.iisd.org/publications/brief/identifying-inefficient-fossil-…
[134] Canada Revenue Agency. 2004. “Classes of Depreciable Property.” Government of Canada. January 16, 2004. https://www.canada.ca/en/revenue-agency/services/tax/businesses/topics/sole-proprietorships-partnerships/report-business-income-expenses/claiming-capital-cost-allowance/classes-depreciable-property.html.
[135] The sectoral breakdown of employment data is not directly comparable to that for corporate financials. Employment data has a separate sector for ‘Support activities for mining, and oil and gas extraction’ while support activities are included with their parent activities in the financial data. In order to make the data comparable, support employees were divided using each the relative employment within the sectors of the parent activities. StatCan table 14-10-0220-01: Employment and average weekly earnings (including overtime) for all employees by industry, monthly, seasonally adjusted, Canada.
